| Red | Green | Blue | |
| z | 17.64 | ||
| znorm | Inf | ||
| sky | -Inf | -NaN | -Inf |
| S/N | 25.0 | 39.9 | 43.3 |
| S/N(c) | 0.0 | 0.0 | 0.0 |
| SN(E/C) |
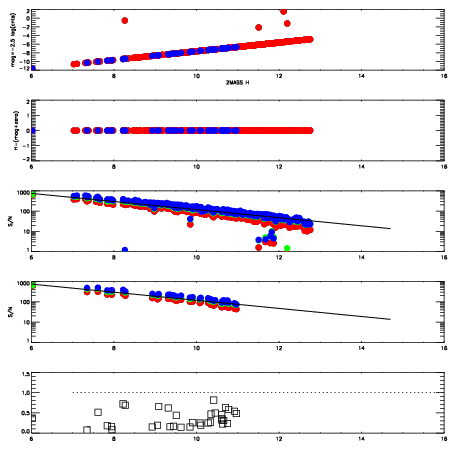
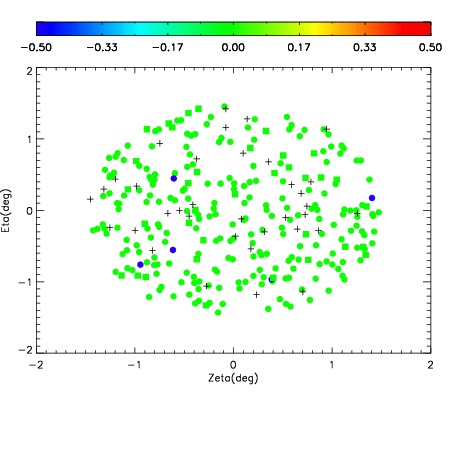
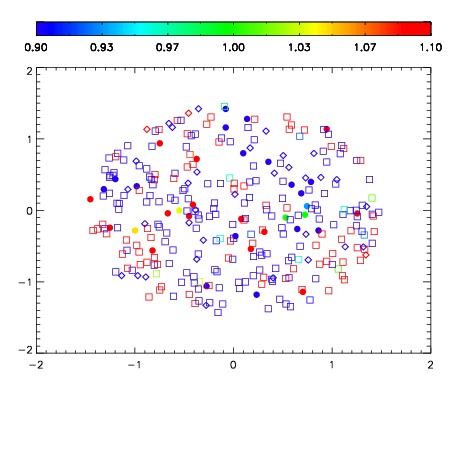
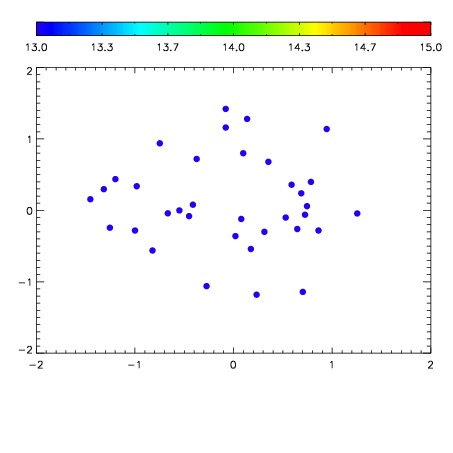

| Frame | Nreads | Zeropoints | Mag plots | Spatial mag deviation | Spatial sky 16325A emission deviations (filled: sky, open: star) | Spatial sky continuum emission | Spatial sky telluric CO2 absorption deviations (filled: H < 10) | |||||||||||||||||||||||
| 0 | 0 |
|
|
|
|
|
|
| IPAIR | NAME | SHIFT | NEWSHIFT | S/N | NAME | SHIFT | NEWSHIFT | S/N |
| 0 | 07800017 | 0.472401 | 0.00000 | 19.0555 | 07800014 | -0.000592011 | 0.472993 | 19.0453 |
| 1 | 07800016 | 0.470700 | 0.00170100 | 19.0688 | 07800018 | 0.00143262 | 0.470968 | 19.0669 |
| 2 | 07800013 | 0.468642 | 0.00375900 | 18.9959 | 07800015 | -0.00126383 | 0.473665 | 18.9721 |
| 3 | 07800012 | 0.467959 | 0.00444201 | 18.5569 | 07800011 | 0.00000 | 0.472401 | 18.6314 |