| Red | Green | Blue | |
| z | 17.64 | ||
| znorm | Inf | ||
| sky | -NaN | -NaN | -Inf |
| S/N | 20.7 | 34.9 | 38.7 |
| S/N(c) | 0.0 | 0.0 | 0.0 |
| SN(E/C) |
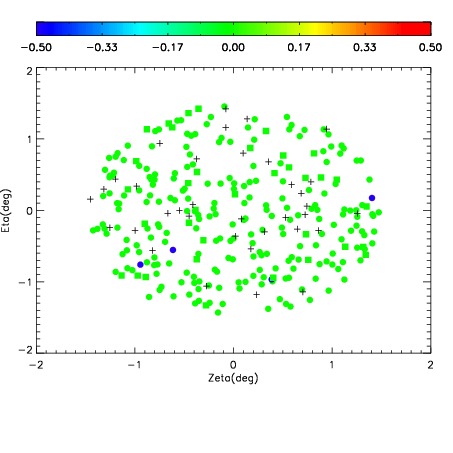
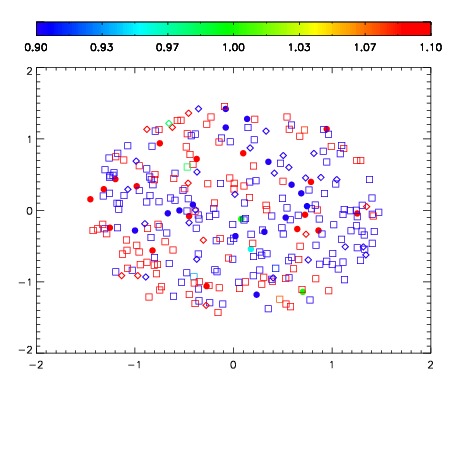
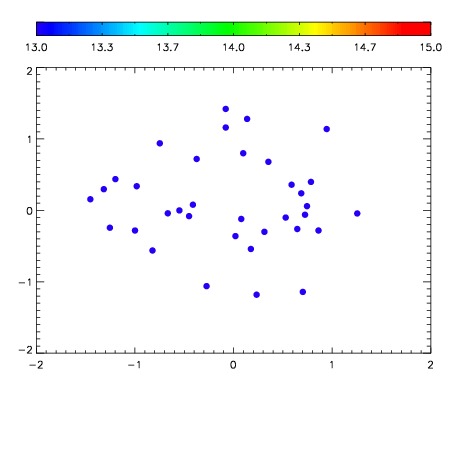

| Frame | Nreads | Zeropoints | Mag plots | Spatial mag deviation | Spatial sky 16325A emission deviations (filled: sky, open: star) | Spatial sky continuum emission | Spatial sky telluric CO2 absorption deviations (filled: H < 10) | |||||||||||||||||||||||
| 0 | 0 |
|
|
|
|
|
|
| IPAIR | NAME | SHIFT | NEWSHIFT | S/N | NAME | SHIFT | NEWSHIFT | S/N |
| 0 | 08140039 | 0.509303 | 0.00000 | 18.8643 | 08140041 | -0.00566154 | 0.514965 | 18.8444 |
| 1 | 08140038 | 0.507875 | 0.00142795 | 18.8620 | 08140040 | -0.00394427 | 0.513247 | 18.8170 |
| 2 | 08140042 | 0.505619 | 0.00368398 | 18.6877 | 08140044 | -0.00329943 | 0.512602 | 18.7294 |
| 3 | 08140043 | 0.506547 | 0.00275600 | 18.6839 | 08140037 | 0.00000 | 0.509303 | 18.7270 |