| Red | Green | Blue | |
| z | 17.64 | ||
| znorm | Inf | ||
| sky | -NaN | -Inf | -NaN |
| S/N | 23.8 | 40.5 | 43.1 |
| S/N(c) | 0.0 | 0.0 | 0.0 |
| SN(E/C) |
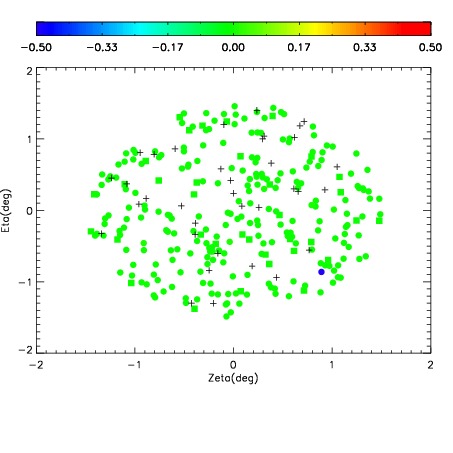

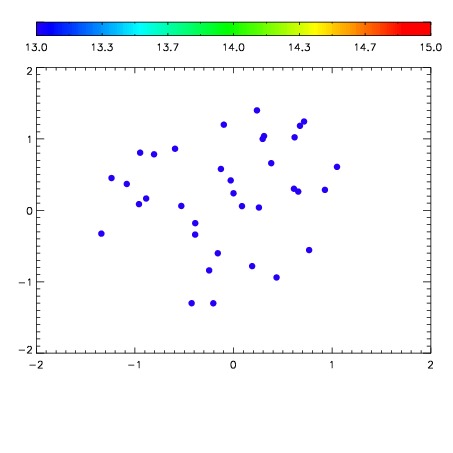

| Frame | Nreads | Zeropoints | Mag plots | Spatial mag deviation | Spatial sky 16325A emission deviations (filled: sky, open: star) | Spatial sky continuum emission | Spatial sky telluric CO2 absorption deviations (filled: H < 10) | |||||||||||||||||||||||
| 0 | 0 |
|
|
|
|
|
|
| IPAIR | NAME | SHIFT | NEWSHIFT | S/N | NAME | SHIFT | NEWSHIFT | S/N |
| 0 | 07030077 | 0.476501 | 0.00000 | 18.8224 | 07030075 | 0.000403632 | 0.476097 | 18.8794 |
| 1 | 07030072 | 0.474151 | 0.00235000 | 18.9247 | 07030074 | 0.000495948 | 0.476005 | 18.9062 |
| 2 | 07030073 | 0.474591 | 0.00191000 | 18.8054 | 07030071 | 0.00000 | 0.476501 | 18.7638 |
| 3 | 07030076 | 0.476021 | 0.000479996 | 18.7343 | 07030078 | 0.00293350 | 0.473567 | 18.7443 |