| Red | Green | Blue | |
| z | 17.63 | ||
| znorm | Inf | ||
| sky | -NaN | -NaN | -Inf |
| S/N | 24.0 | 43.8 | 45.7 |
| S/N(c) | 18.1 | 72.0 | 75.8 |
| SN(E/C) |


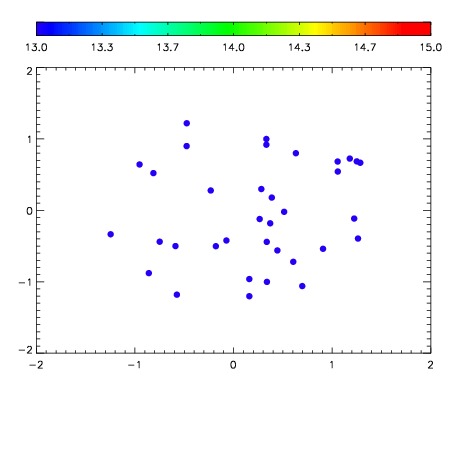

| Frame | Nreads | Zeropoints | Mag plots | Spatial mag deviation | Spatial sky 16325A emission deviations (filled: sky, open: star) | Spatial sky continuum emission | Spatial sky telluric CO2 absorption deviations (filled: H < 10) | |||||||||||||||||||||||
| 0 | 0 |
|
|
|
|
|
|
| IPAIR | NAME | SHIFT | NEWSHIFT | S/N | NAME | SHIFT | NEWSHIFT | S/N |
| 0 | 07610065 | 0.486259 | 0.00000 | 18.8932 | 07610066 | -0.000268192 | 0.486527 | 18.8428 |
| 1 | 07610064 | 0.484574 | 0.00168502 | 18.7521 | 07610063 | -0.00119286 | 0.487452 | 18.7892 |
| 2 | 07610060 | 0.485250 | 0.00100902 | 18.7282 | 07610059 | 0.00000 | 0.486259 | 18.7753 |
| 3 | 07610061 | 0.485263 | 0.000996023 | 18.7272 | 07610062 | 0.000205774 | 0.486053 | 18.7148 |