| Red | Green | Blue | |
| z | 17.63 | ||
| znorm | Inf | ||
| sky | -NaN | -NaN | -Inf |
| S/N | 17.2 | 34.6 | 37.2 |
| S/N(c) | 22.1 | 23.6 | 0.3 |
| SN(E/C) |
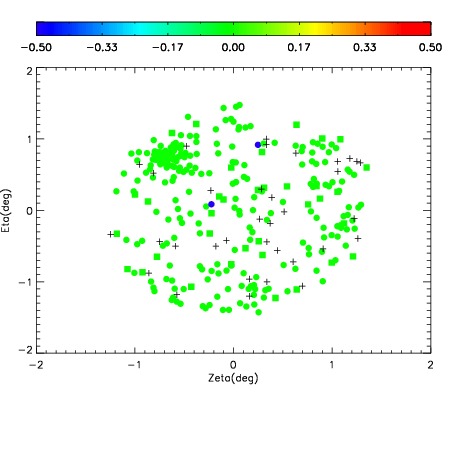
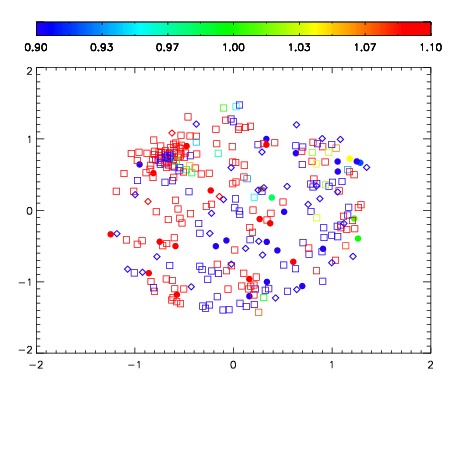


| Frame | Nreads | Zeropoints | Mag plots | Spatial mag deviation | Spatial sky 16325A emission deviations (filled: sky, open: star) | Spatial sky continuum emission | Spatial sky telluric CO2 absorption deviations (filled: H < 10) | |||||||||||||||||||||||
| 0 | 0 |
|
|
|
|
|
|
| IPAIR | NAME | SHIFT | NEWSHIFT | S/N | NAME | SHIFT | NEWSHIFT | S/N |
| 0 | 07840059 | 0.477267 | 0.00000 | 18.5210 | 07840060 | -6.82427e-05 | 0.477335 | 18.3975 |
| 1 | 07840058 | 0.476962 | 0.000304997 | 18.5244 | 07840057 | -0.00100950 | 0.478276 | 18.4487 |
| 2 | 07840054 | 0.475767 | 0.00150001 | 18.4030 | 07840053 | 0.00000 | 0.477267 | 18.2624 |
| 3 | 07840055 | 0.476993 | 0.000274003 | 18.2591 | 07840056 | -0.000760200 | 0.478027 | 18.2547 |