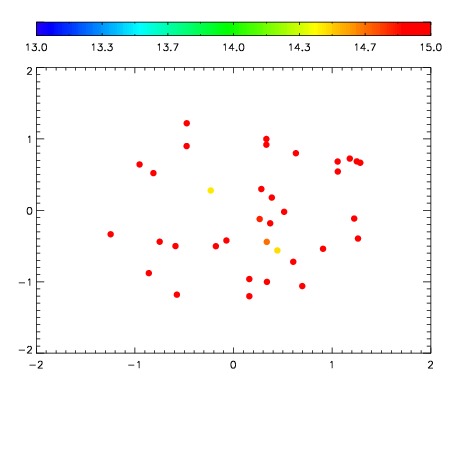
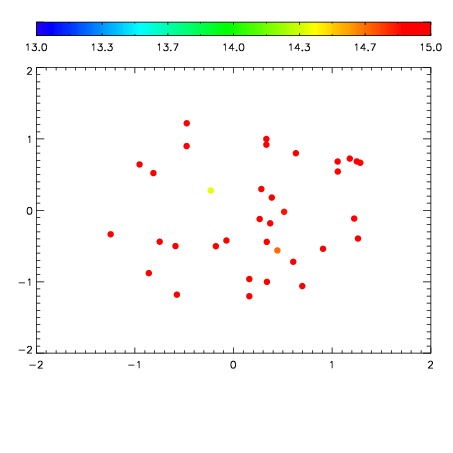
| Frame | Nreads | Zeropoints | Mag plots
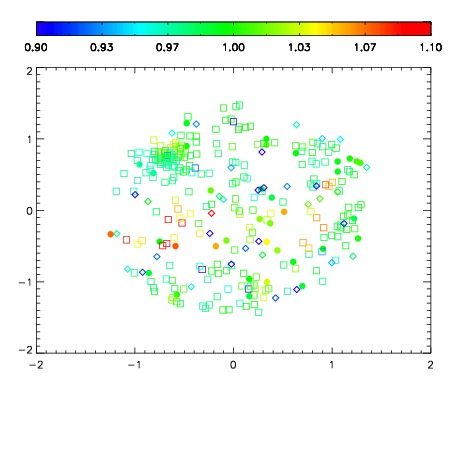
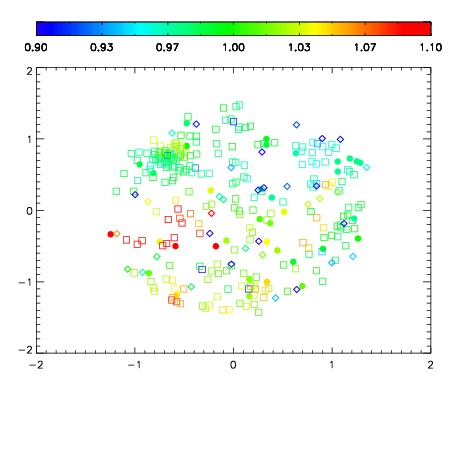
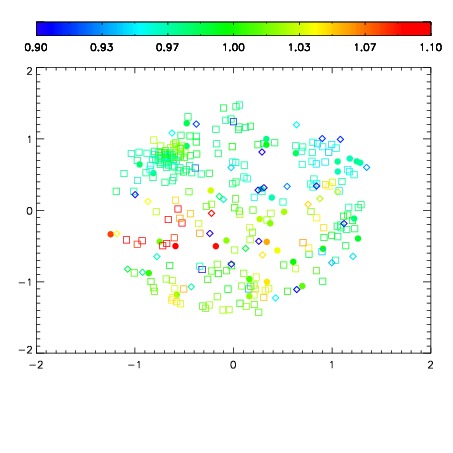
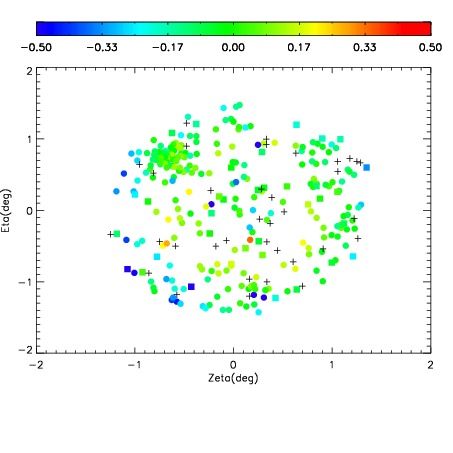
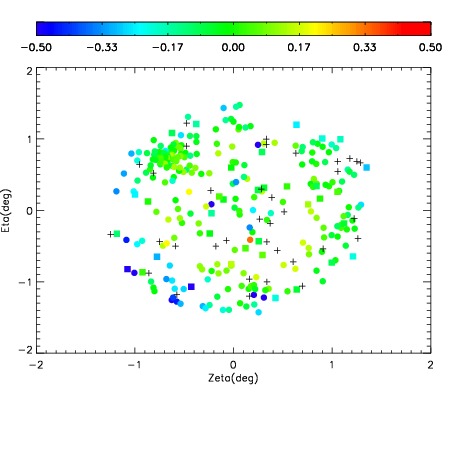
| Spatial mag deviation
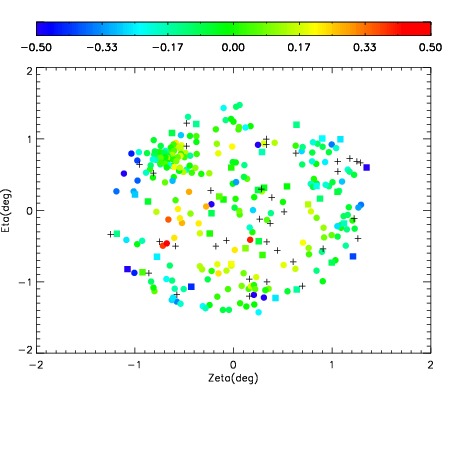
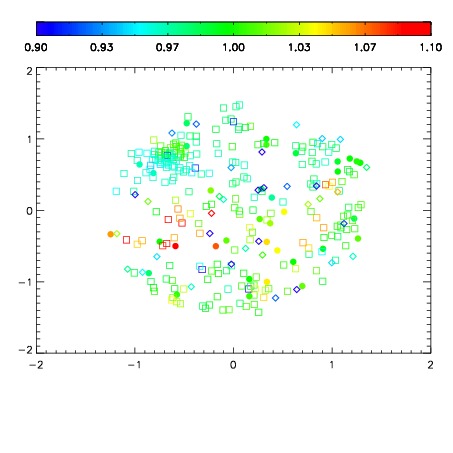
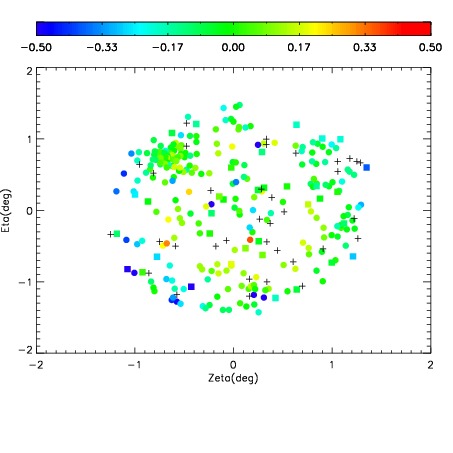
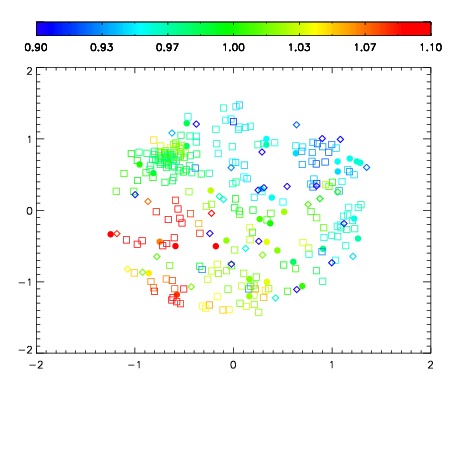
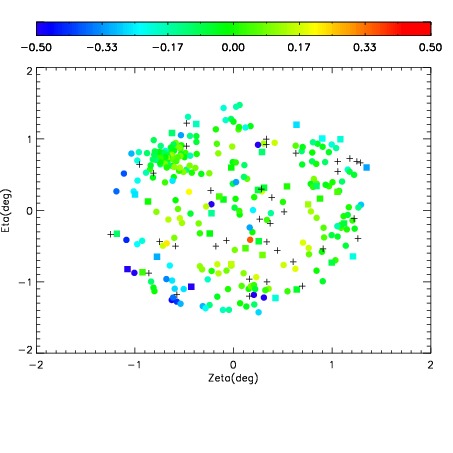
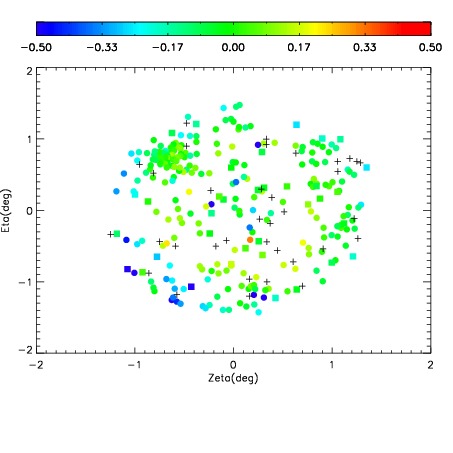
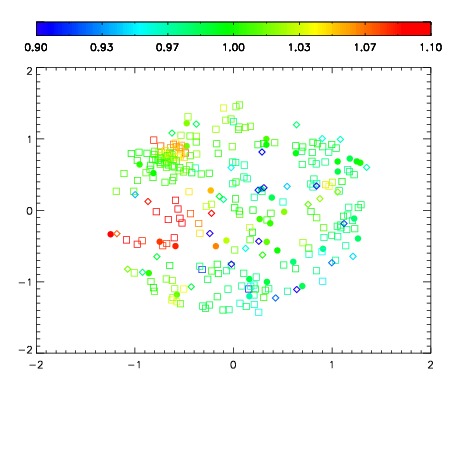
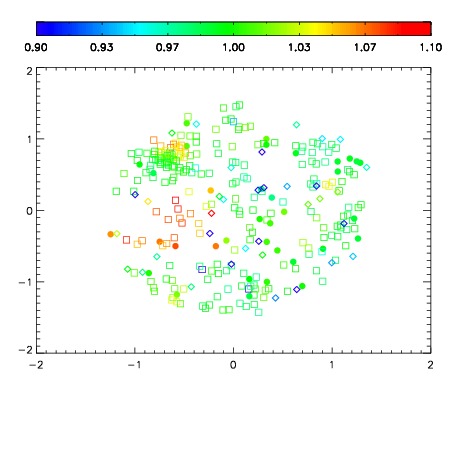
| Spatial sky 16325A emission deviations (filled: sky, open: star)
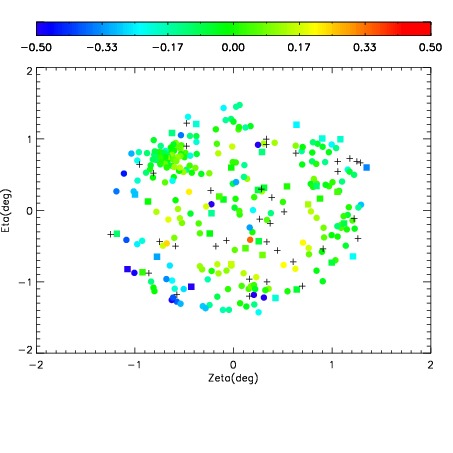
| Spatial sky continuum emission
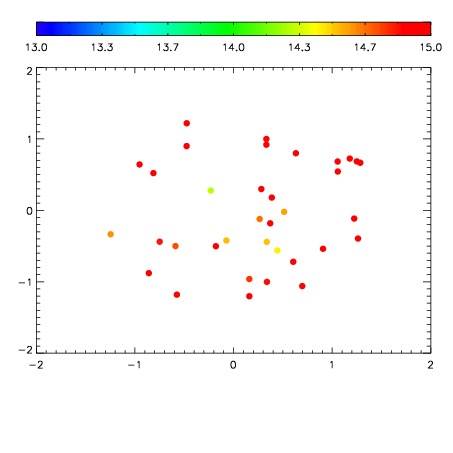
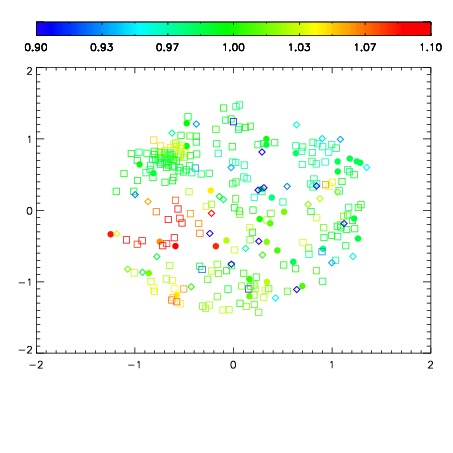
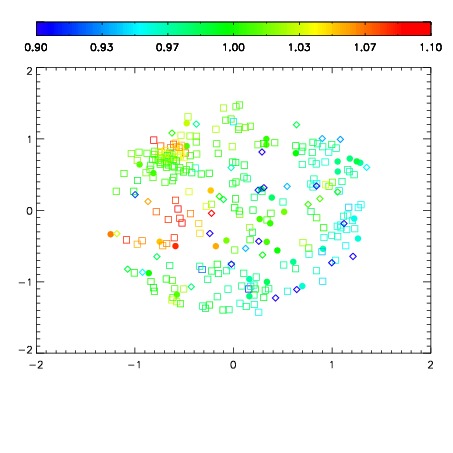
| Spatial sky telluric CO2 absorption deviations (filled: H < 10)
|
| 7890059
| 47
| | Red | Green | Blue
| | z | | 18.78
| | znorm | | 14.60
| | sky | 15.3 | 15.1 | 14.8
| | S/N | 12.3 | 21.5 | 21.3
| | S/N(c) | 10.8 | 41.7 | 42.6
| | SN(E/C) 0.36
|
| 
| 
| 
| 
| 
|
| 7890060
| 47
| | Red | Green | Blue
| | z | | 18.87
| | znorm | | 14.69
| | sky | 15.8 | 15.1 | 15.6
| | S/N | 13.3 | 23.0 | 24.1
| | S/N(c) | 11.7 | 43.9 | 45.8
| | SN(E/C) 0.36
|
| 
| 
| 
| 
| 
|
| 7890061
| 47
| | Red | Green | Blue
| | z | | 18.94
| | znorm | | 14.76
| | sky | 17.3 | 15.4 | 15.4
| | S/N | 13.8 | 23.8 | 24.7
| | S/N(c) | 11.9 | 45.2 | 47.1
| | SN(E/C) 0.35
|
| 
| 
| 
| 
| 
|
| 7890062
| 47
| | Red | Green | Blue
| | z | | 18.85
| | znorm | | 14.67
| | sky | 15.5 | 15.3 | 15.6
| | S/N | 13.0 | 22.8 | 23.9
| | S/N(c) | 11.5 | 43.6 | 45.8
| | SN(E/C) 0.37
|
| 
| 
| 
| 
| 
|
| 7890063
| 47
| | Red | Green | Blue
| | z | | 18.90
| | znorm | | 14.72
| | sky | 16.1 | 15.4 | 16.0
| | S/N | 13.3 | 23.6 | 25.5
| | S/N(c) | 11.9 | 44.4 | 46.9
| | SN(E/C) 0.37
|
| 
| 
| 
| 
| 
|
| 7890064
| 47
| | Red | Green | Blue
| | z | | 18.94
| | znorm | | 14.76
| | sky | 16.6 | 15.6 | 15.8
| | S/N | 13.9 | 24.0 | 25.5
| | S/N(c) | 11.9 | 45.2 | 47.8
| | SN(E/C) 0.37
|
| 
| 
| 
| 
| 
|
| 7890065
| 47
| | Red | Green | Blue
| | z | | 18.94
| | znorm | | 14.76
| | sky | 15.5 | 15.5 | 15.8
| | S/N | 13.6 | 24.1 | 25.6
| | S/N(c) | 12.1 | 45.1 | 48.2
| | SN(E/C) 0.37
|
| 
| 
| 
| 
| 
|
| 7890066
| 47
| | Red | Green | Blue
| | z | | 18.94
| | znorm | | 14.76
| | sky | 16.3 | 15.5 | 15.7
| | S/N | 13.9 | 24.2 | 25.7
| | S/N(c) | 12.1 | 45.1 | 48.4
| | SN(E/C) 0.36
|
| 
| 
| 
| 
| 
|
| 7890067
| 47
| | Red | Green | Blue
| | z | | 18.88
| | znorm | | 14.70
| | sky | 15.7 | 15.4 | 15.5
| | S/N | 13.2 | 23.7 | 25.1
| | S/N(c) | 11.7 | 43.5 | 47.2
| | SN(E/C) 0.36
|
| 
| 
| 
| 
| 
|
| 7890068
| 47
| | Red | Green | Blue
| | z | | 19.01
| | znorm | | 14.82
| | sky | 15.3 | 15.5 | 15.4
| | S/N | 14.6 | 25.3 | 27.1
| | S/N(c) | 12.5 | 46.3 | 50.0
| | SN(E/C) 0.36
|
| 
| 
| 
| 
| 
|