| Red | Green | Blue | |
| z | 17.63 | ||
| znorm | Inf | ||
| sky | -NaN | -NaN | -Inf |
| S/N | 26.4 | 49.9 | 53.2 |
| S/N(c) | 21.6 | 85.7 | 89.7 |
| SN(E/C) |
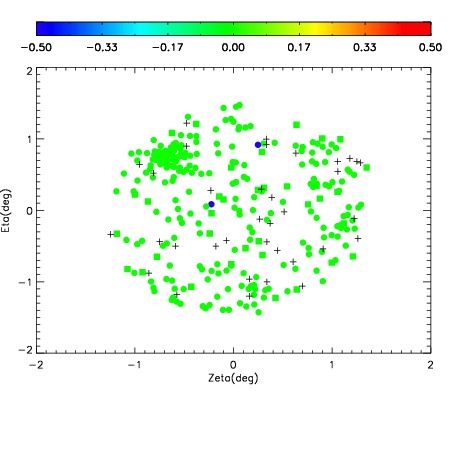
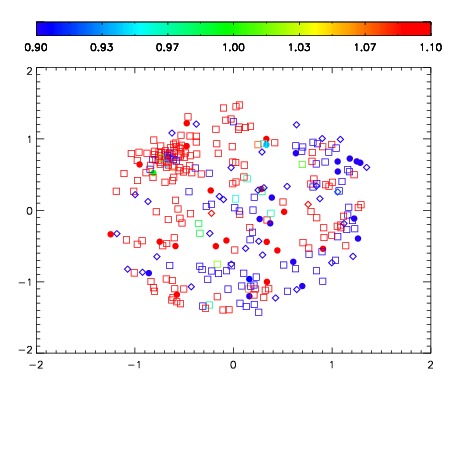
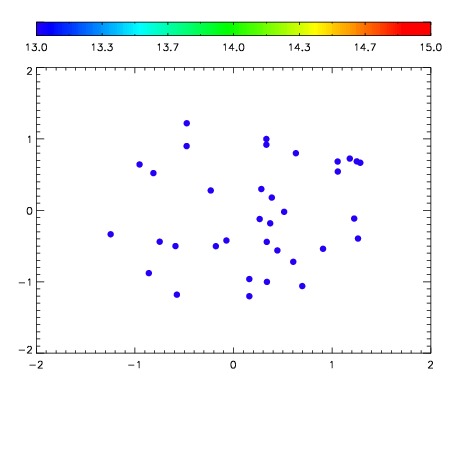

| Frame | Nreads | Zeropoints | Mag plots | Spatial mag deviation | Spatial sky 16325A emission deviations (filled: sky, open: star) | Spatial sky continuum emission | Spatial sky telluric CO2 absorption deviations (filled: H < 10) | |||||||||||||||||||||||
| 0 | 0 |
|
|
|
|
|
|
| IPAIR | NAME | SHIFT | NEWSHIFT | S/N | NAME | SHIFT | NEWSHIFT | S/N |
| 0 | 07890061 | 0.476077 | 0.00000 | 18.9249 | 07890063 | 7.23747e-05 | 0.476005 | 18.8927 |
| 1 | 07890068 | 0.469477 | 0.00659999 | 19.0035 | 07890066 | 0.00193134 | 0.474146 | 18.9229 |
| 2 | 07890065 | 0.470163 | 0.00591400 | 18.9221 | 07890067 | 0.00154792 | 0.474529 | 18.8641 |
| 3 | 07890064 | 0.469496 | 0.00658098 | 18.9181 | 07890062 | 0.00127077 | 0.474806 | 18.8511 |
| 4 | 07890060 | 0.474809 | 0.00126800 | 18.8787 | 07890059 | 0.00000 | 0.476077 | 18.7655 |