| Red | Green | Blue | |
| z | 17.64 | ||
| znorm | Inf | ||
| sky | -Inf | -Inf | -Inf |
| S/N | 24.2 | 43.0 | 46.9 |
| S/N(c) | 28.4 | 28.1 | 66.4 |
| SN(E/C) |
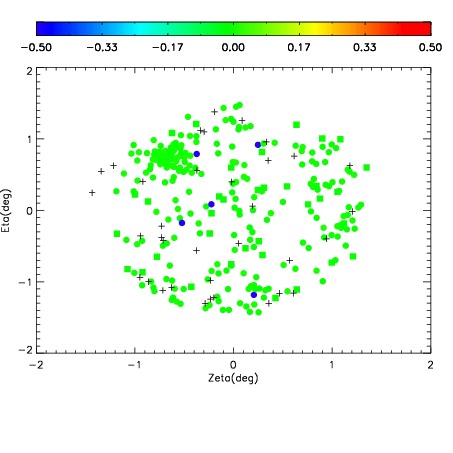
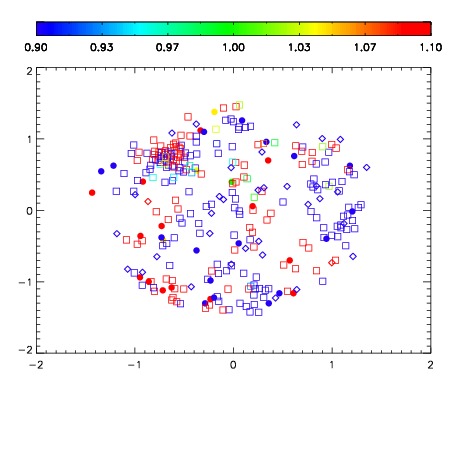
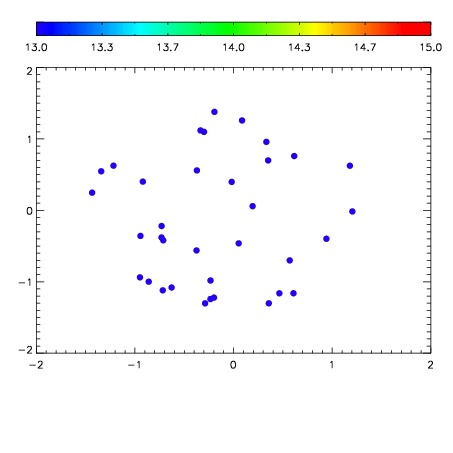

| Frame | Nreads | Zeropoints | Mag plots | Spatial mag deviation | Spatial sky 16325A emission deviations (filled: sky, open: star) | Spatial sky continuum emission | Spatial sky telluric CO2 absorption deviations (filled: H < 10) | |||||||||||||||||||||||
| 0 | 0 |
|
|
|
|
|
|
| IPAIR | NAME | SHIFT | NEWSHIFT | S/N | NAME | SHIFT | NEWSHIFT | S/N |
| 0 | 07620050 | 0.488256 | 0.00000 | 18.7408 | 07620048 | 0.00000 | 0.488256 | 18.6250 |
| 1 | 07620049 | 0.487641 | 0.000615001 | 18.8308 | 07620055 | 0.000884284 | 0.487372 | 19.0675 |
| 2 | 07620054 | 0.485497 | 0.00275901 | 18.8301 | 07620051 | 0.00268232 | 0.485574 | 18.8989 |
| 3 | 07620053 | 0.485290 | 0.00296602 | 18.6498 | 07620052 | 0.00167882 | 0.486577 | 18.6230 |