| Red | Green | Blue | |
| z | 17.64 | ||
| znorm | Inf | ||
| sky | -Inf | -NaN | -Inf |
| S/N | 26.5 | 45.6 | 51.0 |
| S/N(c) | 20.5 | 50.5 | 89.1 |
| SN(E/C) |
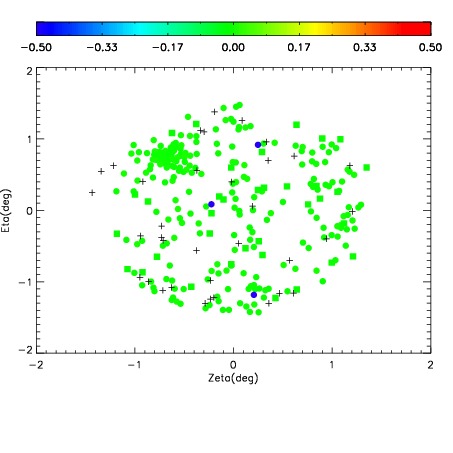
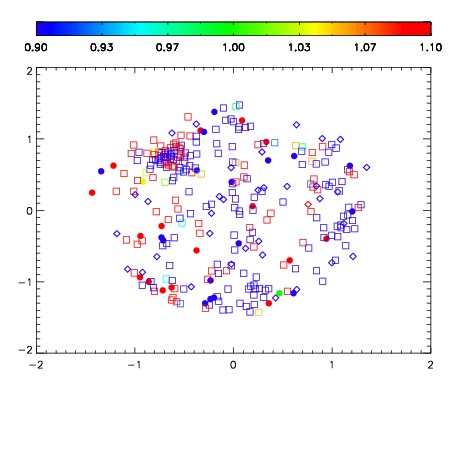


| Frame | Nreads | Zeropoints | Mag plots | Spatial mag deviation | Spatial sky 16325A emission deviations (filled: sky, open: star) | Spatial sky continuum emission | Spatial sky telluric CO2 absorption deviations (filled: H < 10) | |||||||||||||||||||||||
| 0 | 0 |
|
|
|
|
|
|
| IPAIR | NAME | SHIFT | NEWSHIFT | S/N | NAME | SHIFT | NEWSHIFT | S/N |
| 0 | 07850076 | 0.470237 | 0.00000 | 18.9260 | 07850077 | 0.00339454 | 0.466842 | 18.9234 |
| 1 | 07850075 | 0.469725 | 0.000511974 | 19.0046 | 07850074 | 0.00196248 | 0.468275 | 18.9357 |
| 2 | 07850072 | 0.470010 | 0.000226974 | 18.8991 | 07850073 | 0.00218626 | 0.468051 | 18.8918 |
| 3 | 07850071 | 0.469873 | 0.000363976 | 18.8873 | 07850070 | 0.00000 | 0.470237 | 18.7998 |