| Red | Green | Blue | |
| z | 17.64 | ||
| znorm | Inf | ||
| sky | -Inf | -NaN | -Inf |
| S/N | 24.6 | 43.9 | 47.5 |
| S/N(c) | 19.0 | 48.5 | 90.7 |
| SN(E/C) |
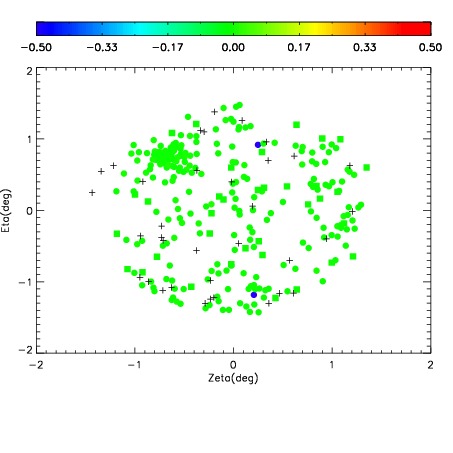
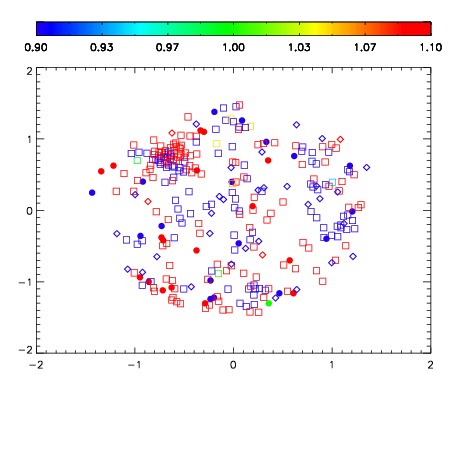
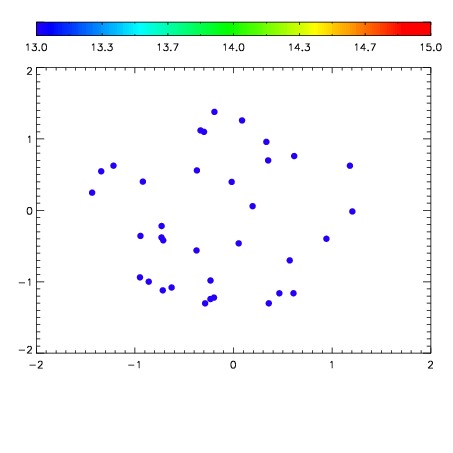

| Frame | Nreads | Zeropoints | Mag plots | Spatial mag deviation | Spatial sky 16325A emission deviations (filled: sky, open: star) | Spatial sky continuum emission | Spatial sky telluric CO2 absorption deviations (filled: H < 10) | |||||||||||||||||||||||
| 0 | 0 |
|
|
|
|
|
|
| IPAIR | NAME | SHIFT | NEWSHIFT | S/N | NAME | SHIFT | NEWSHIFT | S/N |
| 0 | 07900053 | 0.468002 | 0.00000 | 18.8421 | 07900055 | 0.000953959 | 0.467048 | 18.8037 |
| 1 | 07900050 | 0.467941 | 6.10054e-05 | 18.9364 | 07900051 | 0.00136109 | 0.466641 | 18.9351 |
| 2 | 07900049 | 0.467205 | 0.000797004 | 18.9041 | 07900052 | 0.00113099 | 0.466871 | 18.8694 |
| 3 | 07900054 | 0.467463 | 0.000539005 | 18.8755 | 07900048 | 0.00000 | 0.468002 | 18.8460 |