| Red | Green | Blue | |
| z | 17.64 | ||
| znorm | Inf | ||
| sky | -NaN | -NaN | -Inf |
| S/N | 15.3 | 28.1 | 32.8 |
| S/N(c) | 19.1 | 54.7 | 24.8 |
| SN(E/C) |
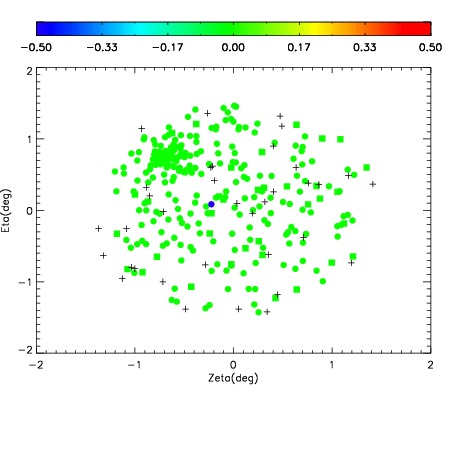
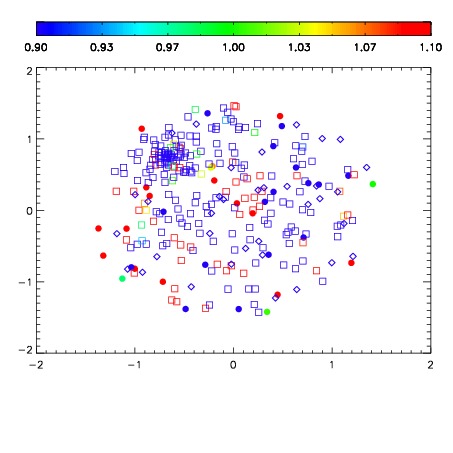
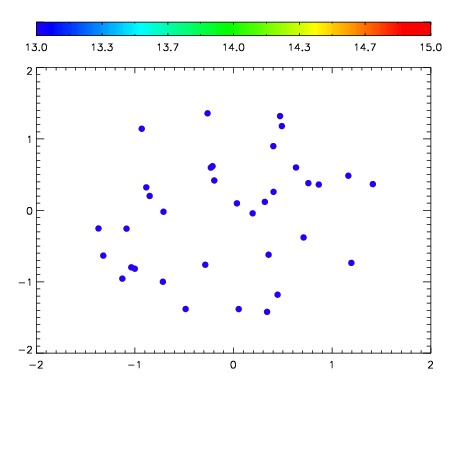

| Frame | Nreads | Zeropoints | Mag plots | Spatial mag deviation | Spatial sky 16325A emission deviations (filled: sky, open: star) | Spatial sky continuum emission | Spatial sky telluric CO2 absorption deviations (filled: H < 10) | |||||||||||||||||||||||
| 0 | 0 |
|
|
|
|
|
|
| IPAIR | NAME | SHIFT | NEWSHIFT | S/N | NAME | SHIFT | NEWSHIFT | S/N |
| 0 | 07630055 | 0.485448 | 0.00000 | 17.6417 | 07630054 | 0.00000 | 0.485448 | 17.4674 |
| 1 | 07630056 | 0.485398 | 5.00083e-05 | 18.7727 | 07630057 | -0.000775427 | 0.486223 | 18.9958 |
| 2 | 07630059 | 0.484503 | 0.000945002 | 18.4441 | 07630058 | -0.00133680 | 0.486785 | 18.7216 |