| Red | Green | Blue | |
| z | 17.64 | ||
| znorm | Inf | ||
| sky | -Inf | -Inf | -Inf |
| S/N | 30.2 | 51.7 | 54.6 |
| S/N(c) | 38.9 | 73.2 | 48.1 |
| SN(E/C) |
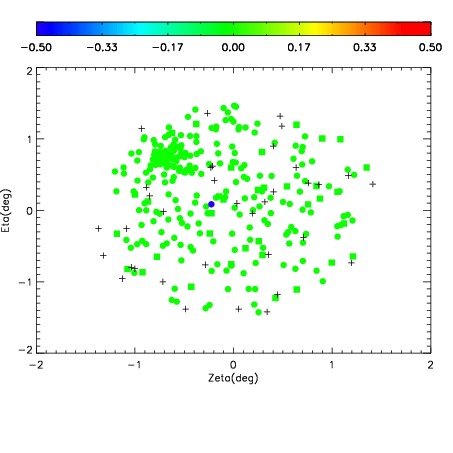


| Frame | Nreads | Zeropoints | Mag plots | Spatial mag deviation | Spatial sky 16325A emission deviations (filled: sky, open: star) | Spatial sky continuum emission | Spatial sky telluric CO2 absorption deviations (filled: H < 10) | |||||||||||||||||||||||
| 0 | 0 |
|
|
|
|
|
|
| IPAIR | NAME | SHIFT | NEWSHIFT | S/N | NAME | SHIFT | NEWSHIFT | S/N |
| 0 | 07870077 | 0.469326 | 0.00000 | 19.1436 | 07870078 | 0.000515243 | 0.468811 | 19.0987 |
| 1 | 07870076 | 0.468735 | 0.000590980 | 19.1227 | 07870079 | -0.000219184 | 0.469545 | 19.0971 |
| 2 | 07870080 | 0.467773 | 0.00155300 | 19.0943 | 07870082 | 3.28054e-05 | 0.469293 | 19.0871 |
| 3 | 07870081 | 0.468087 | 0.00123900 | 19.0880 | 07870075 | 0.00000 | 0.469326 | 19.0742 |