| Red | Green | Blue | |
| z | 17.63 | ||
| znorm | Inf | ||
| sky | -NaN | -NaN | -Inf |
| S/N | 31.1 | 51.2 | 55.0 |
| S/N(c) | 40.7 | 50.2 | 105.3 |
| SN(E/C) |
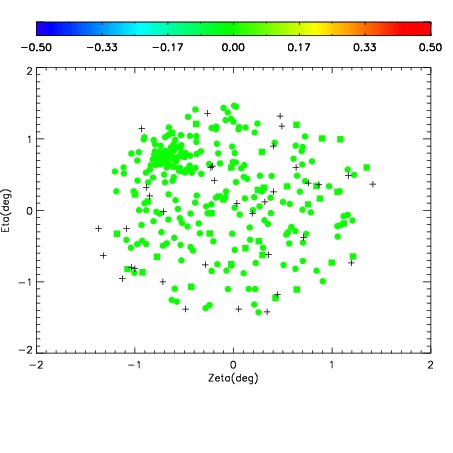
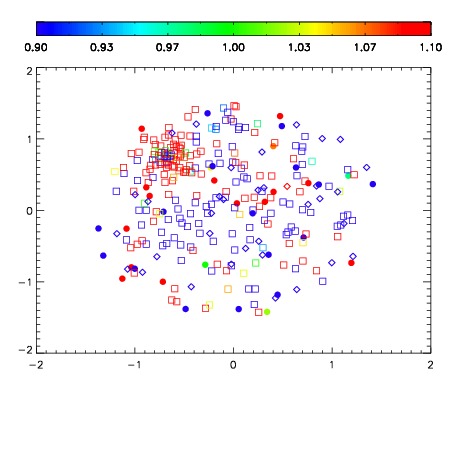
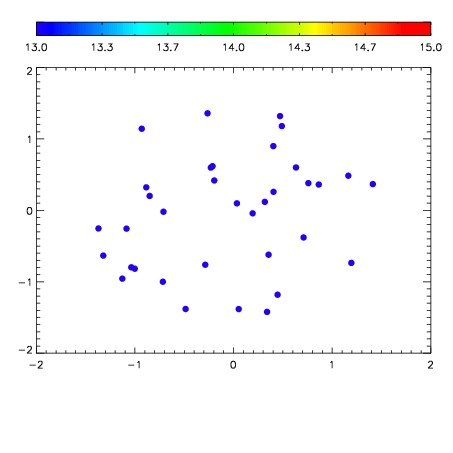

| Frame | Nreads | Zeropoints | Mag plots | Spatial mag deviation | Spatial sky 16325A emission deviations (filled: sky, open: star) | Spatial sky continuum emission | Spatial sky telluric CO2 absorption deviations (filled: H < 10) | |||||||||||||||||||||||
| 0 | 0 |
|
|
|
|
|
|
| IPAIR | NAME | SHIFT | NEWSHIFT | S/N | NAME | SHIFT | NEWSHIFT | S/N |
| 0 | 07910040 | 0.502700 | 0.00000 | 19.1916 | 07910038 | 0.00000 | 0.502700 | 19.1574 |
| 1 | 07910043 | 0.499735 | 0.00296497 | 19.2166 | 07910042 | -0.000954342 | 0.503654 | 19.2166 |
| 2 | 07910044 | 0.501717 | 0.000983000 | 19.1972 | 07910045 | -0.000142537 | 0.502842 | 19.1995 |
| 3 | 07910039 | 0.499727 | 0.00297296 | 19.1764 | 07910041 | 0.000728217 | 0.501972 | 19.1550 |