| Red | Green | Blue | |
| z | 17.63 | ||
| znorm | Inf | ||
| sky | -NaN | -NaN | -Inf |
| S/N | 32.3 | 53.6 | 56.5 |
| S/N(c) | 32.4 | 76.6 | 69.4 |
| SN(E/C) |

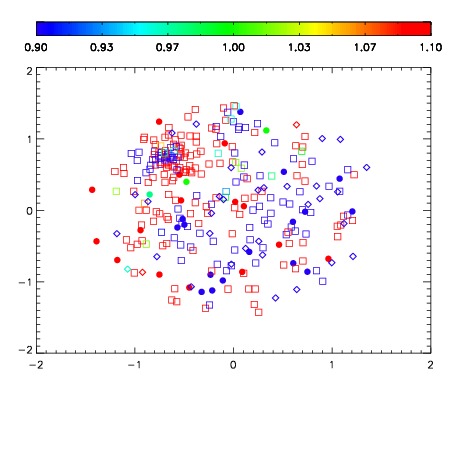
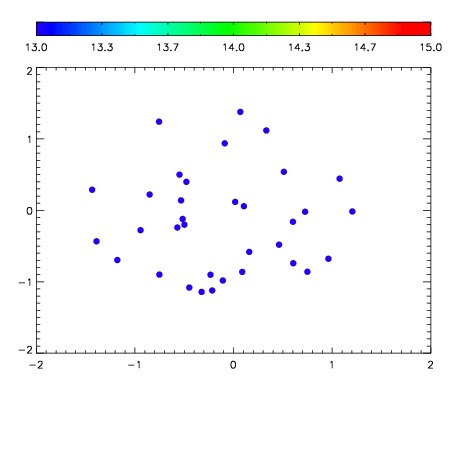

| Frame | Nreads | Zeropoints | Mag plots | Spatial mag deviation | Spatial sky 16325A emission deviations (filled: sky, open: star) | Spatial sky continuum emission | Spatial sky telluric CO2 absorption deviations (filled: H < 10) | |||||||||||||||||||||||
| 0 | 0 |
|
|
|
|
|
|
| IPAIR | NAME | SHIFT | NEWSHIFT | S/N | NAME | SHIFT | NEWSHIFT | S/N |
| 0 | 07920071 | 0.493226 | 0.00000 | 19.0930 | 07920070 | 0.00000 | 0.493226 | 19.0570 |
| 1 | 07920072 | 0.493119 | 0.000106990 | 19.1920 | 07920073 | -0.000854362 | 0.494080 | 19.2126 |
| 2 | 07920079 | 0.489110 | 0.00411600 | 19.1867 | 07920077 | -0.00375283 | 0.496979 | 19.1961 |
| 3 | 07920080 | 0.490528 | 0.00269800 | 19.1774 | 07920081 | -0.00390777 | 0.497134 | 19.1177 |
| 4 | 07920075 | 0.488771 | 0.00445500 | 19.1312 | 07920074 | -0.00371900 | 0.496945 | 19.1129 |
| 5 | 07920076 | 0.489729 | 0.00349700 | 19.1164 | 07920078 | -0.00461729 | 0.497843 | 19.0572 |