| Red | Green | Blue | |
| z | 17.64 | ||
| znorm | Inf | ||
| sky | -Inf | -Inf | -Inf |
| S/N | 21.4 | 36.5 | 37.9 |
| S/N(c) | 36.8 | 32.1 | 62.0 |
| SN(E/C) |
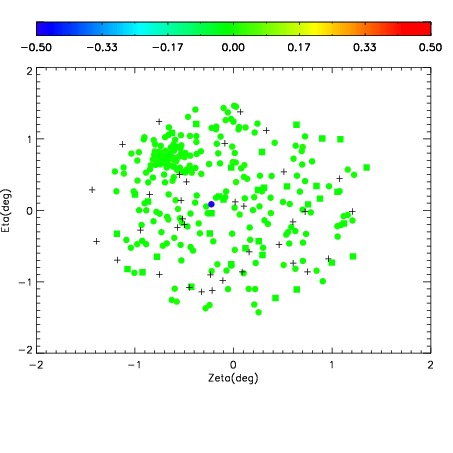
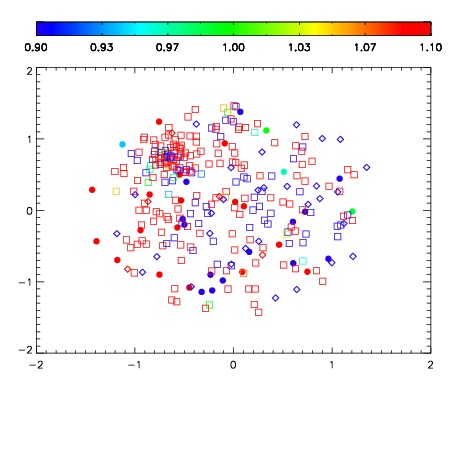
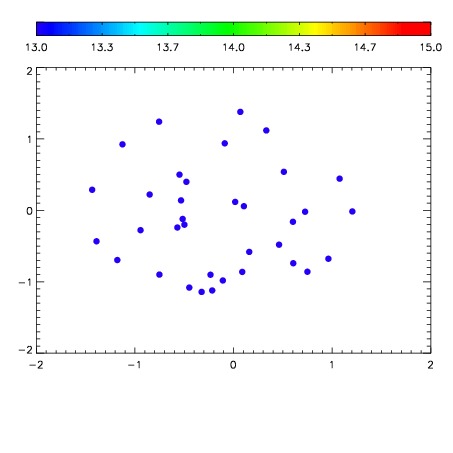

| Frame | Nreads | Zeropoints | Mag plots | Spatial mag deviation | Spatial sky 16325A emission deviations (filled: sky, open: star) | Spatial sky continuum emission | Spatial sky telluric CO2 absorption deviations (filled: H < 10) | |||||||||||||||||||||||
| 0 | 0 |
|
|
|
|
|
|
| IPAIR | NAME | SHIFT | NEWSHIFT | S/N | NAME | SHIFT | NEWSHIFT | S/N |
| 0 | 08190053 | 0.509685 | 0.00000 | 18.7888 | 08190051 | -0.00227534 | 0.511960 | 18.6757 |
| 1 | 08190048 | 0.503858 | 0.00582701 | 19.0566 | 08190047 | 0.00000 | 0.509685 | 19.0961 |
| 2 | 08190049 | 0.508025 | 0.00165999 | 19.0549 | 08190050 | 0.000827264 | 0.508858 | 18.8498 |
| 3 | 08190052 | 0.504401 | 0.00528395 | 18.7972 | 08190054 | -0.000676550 | 0.510362 | 18.7584 |