| Red | Green | Blue | |
| z | 17.64 | ||
| znorm | Inf | ||
| sky | -Inf | -Inf | -Inf |
| S/N | 3.9 | 7.3 | 8.1 |
| S/N(c) | 0.0 | 0.0 | 0.0 |
| SN(E/C) |
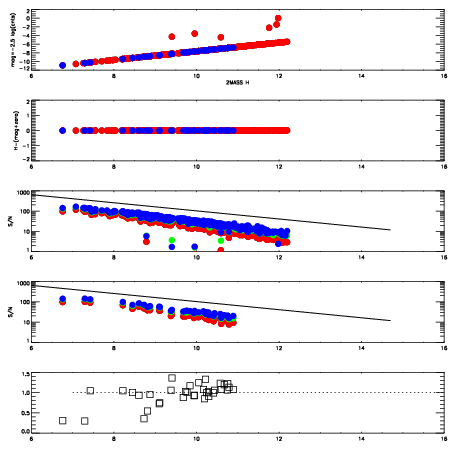
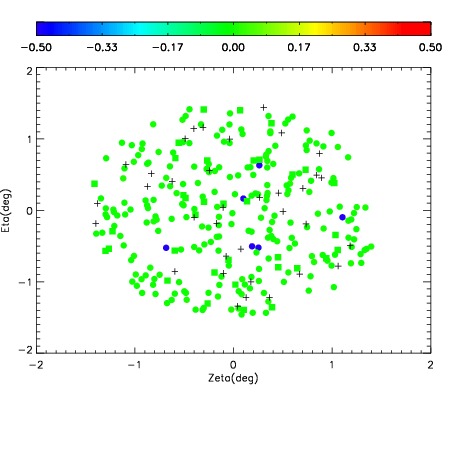
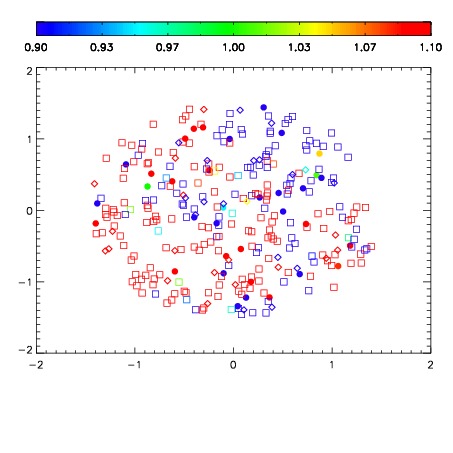
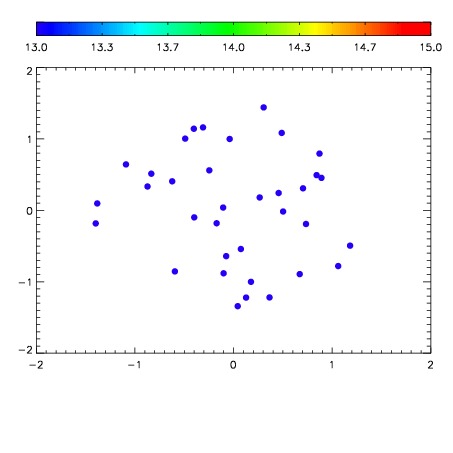

| Frame | Nreads | Zeropoints | Mag plots | Spatial mag deviation | Spatial sky 16325A emission deviations (filled: sky, open: star) | Spatial sky continuum emission | Spatial sky telluric CO2 absorption deviations (filled: H < 10) | |||||||||||||||||||||||
| 0 | 0 |
|
|
|
|
|
|
| IPAIR | NAME | SHIFT | NEWSHIFT | S/N | NAME | SHIFT | NEWSHIFT | S/N |
| 0 | 07230079 | 0.474906 | 0.00000 | 14.2675 | 07230077 | 0.000512494 | 0.474394 | 15.9158 |
| 1 | 07230075 | 0.473100 | 0.00180599 | 18.0857 | 07230074 | 0.00000 | 0.474906 | 16.7498 |
| 2 | 07230076 | 0.474802 | 0.000104010 | 17.1466 | 07230078 | -8.38613e-05 | 0.474990 | 15.9200 |