| Red | Green | Blue | |
| z | 17.64 | ||
| znorm | Inf | ||
| sky | -Inf | -Inf | -Inf |
| S/N | 21.1 | 38.5 | 40.4 |
| S/N(c) | 0.0 | 0.0 | 0.0 |
| SN(E/C) |
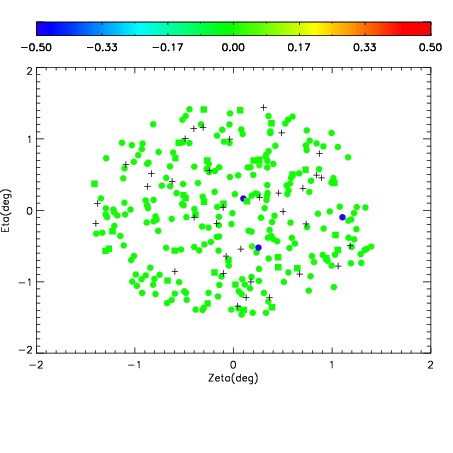
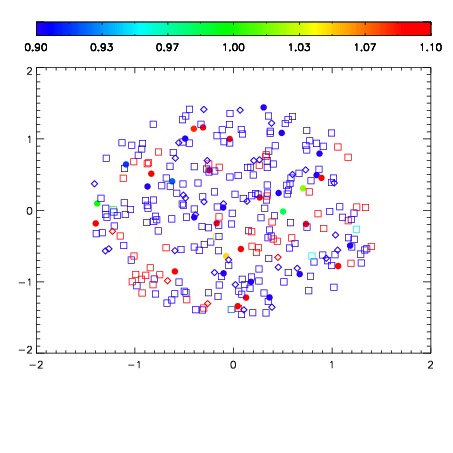


| Frame | Nreads | Zeropoints | Mag plots | Spatial mag deviation | Spatial sky 16325A emission deviations (filled: sky, open: star) | Spatial sky continuum emission | Spatial sky telluric CO2 absorption deviations (filled: H < 10) | |||||||||||||||||||||||
| 0 | 0 |
|
|
|
|
|
|
| IPAIR | NAME | SHIFT | NEWSHIFT | S/N | NAME | SHIFT | NEWSHIFT | S/N |
| 0 | 07610054 | 0.479452 | 0.00000 | 18.5656 | 07610055 | -0.000638390 | 0.480090 | 18.6258 |
| 1 | 07610049 | 0.476703 | 0.00274903 | 18.8649 | 07610051 | 0.00209239 | 0.477360 | 18.8781 |
| 2 | 07610050 | 0.477926 | 0.00152603 | 18.8228 | 07610048 | 0.00000 | 0.479452 | 18.8005 |
| 3 | 07610053 | 0.477592 | 0.00186002 | 18.7291 | 07610052 | 0.000197022 | 0.479255 | 18.7305 |