| Red | Green | Blue | |
| z | 17.64 | ||
| znorm | Inf | ||
| sky | -NaN | -Inf | -Inf |
| S/N | 22.4 | 39.7 | 43.2 |
| S/N(c) | 0.0 | 0.0 | 0.0 |
| SN(E/C) |


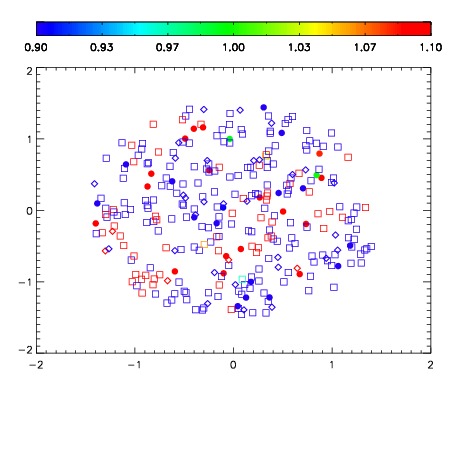


| Frame | Nreads | Zeropoints | Mag plots | Spatial mag deviation | Spatial sky 16325A emission deviations (filled: sky, open: star) | Spatial sky continuum emission | Spatial sky telluric CO2 absorption deviations (filled: H < 10) | |||||||||||||||||||||||
| 0 | 0 |
|
|
|
|
|
|
| IPAIR | NAME | SHIFT | NEWSHIFT | S/N | NAME | SHIFT | NEWSHIFT | S/N |
| 0 | 07850039 | 0.470780 | 0.00000 | 18.8732 | 07850037 | 0.00000 | 0.470780 | 18.8262 |
| 1 | 07850038 | 0.468901 | 0.00187898 | 18.8481 | 07850040 | -0.000443157 | 0.471223 | 18.8011 |
| 2 | 07850043 | 0.469047 | 0.00173298 | 18.7323 | 07850041 | -0.000282042 | 0.471062 | 18.7339 |
| 3 | 07850042 | 0.468800 | 0.00197998 | 18.7224 | 07850044 | 0.000946285 | 0.469834 | 18.6001 |