| Red | Green | Blue | |
| z | 17.64 | ||
| znorm | Inf | ||
| sky | -Inf | -NaN | -Inf |
| S/N | 22.9 | 36.9 | 43.9 |
| S/N(c) | 0.0 | 0.0 | 0.0 |
| SN(E/C) |

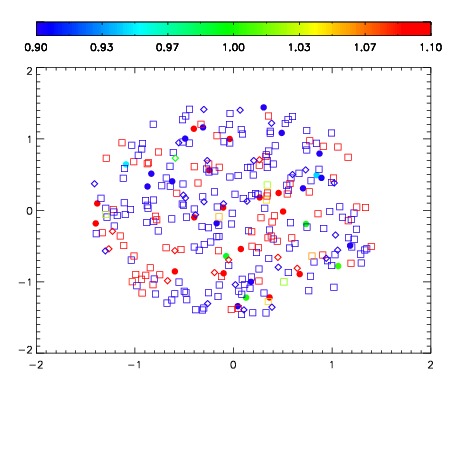


| Frame | Nreads | Zeropoints | Mag plots | Spatial mag deviation | Spatial sky 16325A emission deviations (filled: sky, open: star) | Spatial sky continuum emission | Spatial sky telluric CO2 absorption deviations (filled: H < 10) | |||||||||||||||||||||||
| 0 | 0 |
|
|
|
|
|
|
| IPAIR | NAME | SHIFT | NEWSHIFT | S/N | NAME | SHIFT | NEWSHIFT | S/N |
| 0 | 08170017 | 0.514897 | 0.00000 | 18.7998 | 08170018 | -0.00100491 | 0.515902 | 17.5692 |
| 1 | 08170012 | 0.505461 | 0.00943601 | 19.0148 | 08170011 | 0.00000 | 0.514897 | 19.0006 |
| 2 | 08170016 | 0.504249 | 0.0106480 | 19.0073 | 08170015 | -0.00435024 | 0.519247 | 18.7705 |
| 3 | 08170013 | 0.510808 | 0.00408900 | 18.8172 | 08170014 | -0.00355469 | 0.518452 | 18.4806 |