| Red | Green | Blue | |
| z | 17.64 | ||
| znorm | Inf | ||
| sky | -Inf | -NaN | -Inf |
| S/N | 22.9 | 39.8 | 43.4 |
| S/N(c) | 0.0 | 0.0 | 0.0 |
| SN(E/C) |
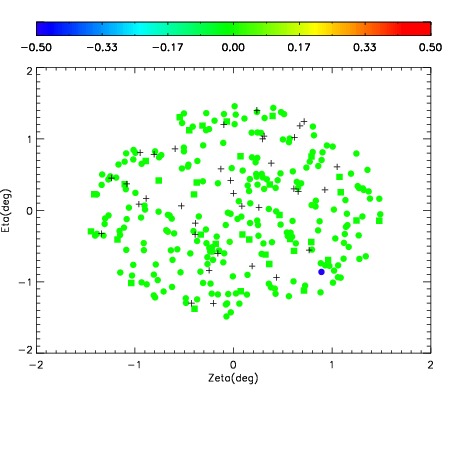
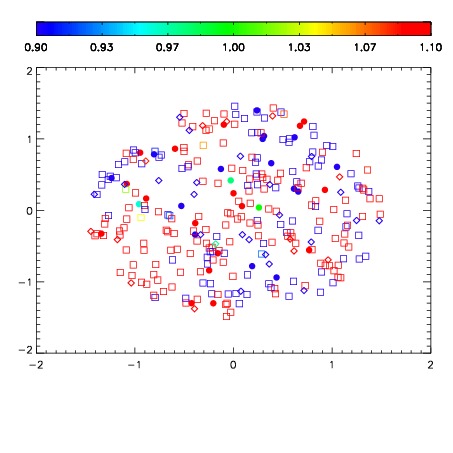


| Frame | Nreads | Zeropoints | Mag plots | Spatial mag deviation | Spatial sky 16325A emission deviations (filled: sky, open: star) | Spatial sky continuum emission | Spatial sky telluric CO2 absorption deviations (filled: H < 10) | |||||||||||||||||||||||
| 0 | 0 |
|
|
|
|
|
|
| IPAIR | NAME | SHIFT | NEWSHIFT | S/N | NAME | SHIFT | NEWSHIFT | S/N |
| 0 | 07530077 | 0.481491 | 0.00000 | 18.8483 | 07530079 | 0.00638219 | 0.475109 | 18.8822 |
| 1 | 07530078 | 0.481315 | 0.000176013 | 18.8337 | 07530075 | 0.00548126 | 0.476010 | 18.7702 |
| 2 | 07530073 | 0.478644 | 0.00284699 | 18.7047 | 07530076 | 0.00435442 | 0.477137 | 18.7017 |
| 3 | 07530074 | 0.479854 | 0.00163701 | 18.6192 | 07530072 | 0.00000 | 0.481491 | 18.5924 |