| Red | Green | Blue | |
| z | 17.64 | ||
| znorm | Inf | ||
| sky | -NaN | -Inf | -NaN |
| S/N | 24.8 | 42.3 | 43.2 |
| S/N(c) | 0.0 | 0.0 | 0.0 |
| SN(E/C) |
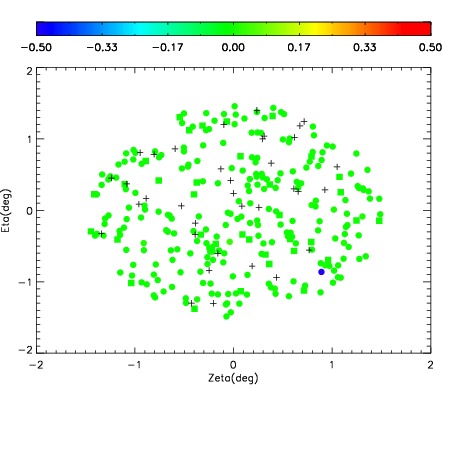
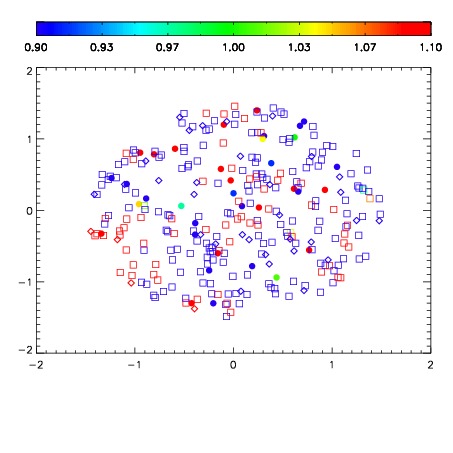
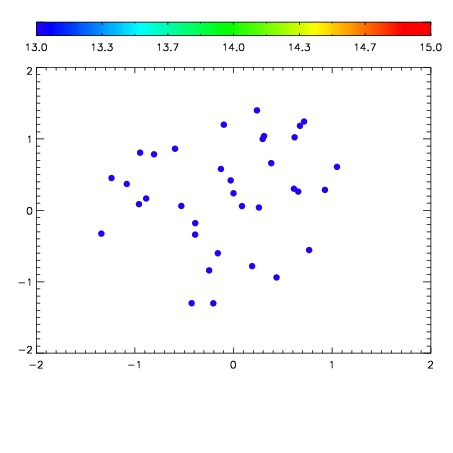

| Frame | Nreads | Zeropoints | Mag plots | Spatial mag deviation | Spatial sky 16325A emission deviations (filled: sky, open: star) | Spatial sky continuum emission | Spatial sky telluric CO2 absorption deviations (filled: H < 10) | |||||||||||||||||||||||
| 0 | 0 |
|
|
|
|
|
|
| IPAIR | NAME | SHIFT | NEWSHIFT | S/N | NAME | SHIFT | NEWSHIFT | S/N |
| 0 | 07620028 | 0.482049 | 0.00000 | 18.6372 | 07620029 | -0.00214160 | 0.484191 | 18.5813 |
| 1 | 07620031 | 0.479217 | 0.00283200 | 19.0298 | 07620033 | -0.00295418 | 0.485003 | 18.8469 |
| 2 | 07620032 | 0.479898 | 0.00215098 | 18.9403 | 07620026 | 0.00000 | 0.482049 | 18.8202 |
| 3 | 07620027 | 0.481439 | 0.000609994 | 18.6381 | 07620030 | -0.00339281 | 0.485442 | 18.8092 |