| Red | Green | Blue | |
| z | 17.64 | ||
| znorm | Inf | ||
| sky | -Inf | -Inf | -Inf |
| S/N | 24.6 | 43.2 | 47.3 |
| S/N(c) | 0.0 | 0.0 | 0.0 |
| SN(E/C) |
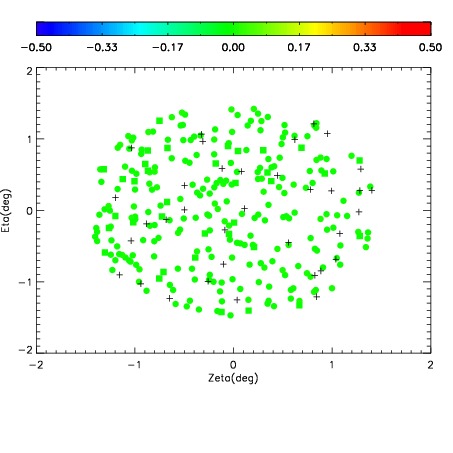
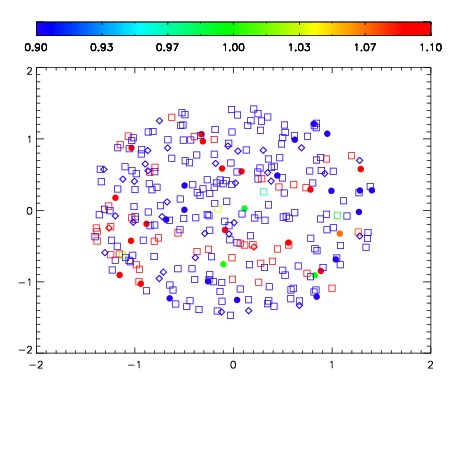


| Frame | Nreads | Zeropoints | Mag plots | Spatial mag deviation | Spatial sky 16325A emission deviations (filled: sky, open: star) | Spatial sky continuum emission | Spatial sky telluric CO2 absorption deviations (filled: H < 10) | |||||||||||||||||||||||
| 0 | 0 |
|
|
|
|
|
|
| IPAIR | NAME | SHIFT | NEWSHIFT | S/N | NAME | SHIFT | NEWSHIFT | S/N |
| 0 | 08140032 | 0.504812 | 0.00000 | 18.9787 | 08140033 | -0.00421434 | 0.509026 | 18.9264 |
| 1 | 08140027 | 0.503531 | 0.00128102 | 18.9529 | 08140029 | -0.00303419 | 0.507846 | 18.8992 |
| 2 | 08140031 | 0.502425 | 0.00238699 | 18.9456 | 08140030 | -0.00408452 | 0.508897 | 18.8367 |
| 3 | 08140028 | 0.504783 | 2.90275e-05 | 18.9037 | 08140026 | 0.00000 | 0.504812 | 18.7423 |