| Red | Green | Blue | |
| z | 17.64 | ||
| znorm | Inf | ||
| sky | -Inf | -Inf | -Inf |
| S/N | 29.6 | 50.4 | 55.6 |
| S/N(c) | 0.0 | 0.0 | 0.0 |
| SN(E/C) |
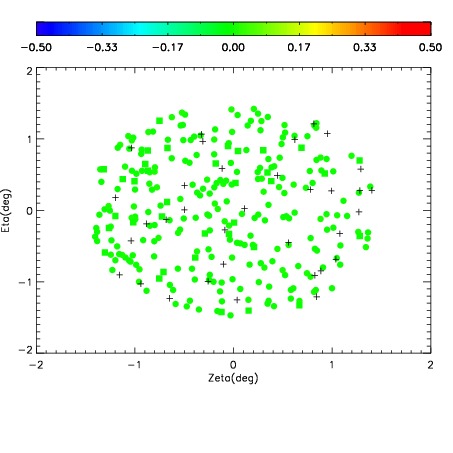
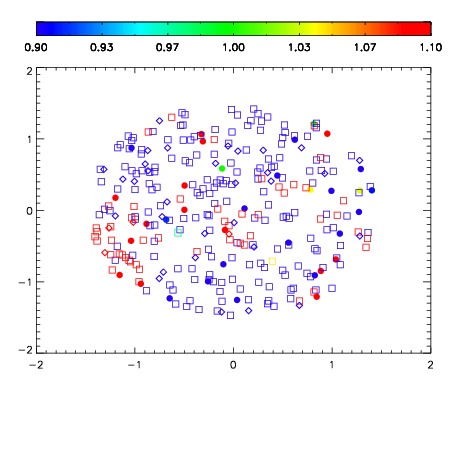
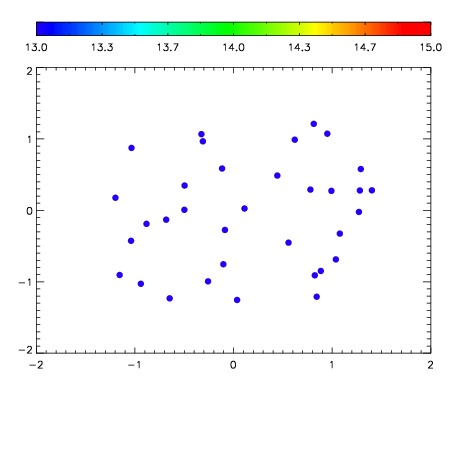

| Frame | Nreads | Zeropoints | Mag plots | Spatial mag deviation | Spatial sky 16325A emission deviations (filled: sky, open: star) | Spatial sky continuum emission | Spatial sky telluric CO2 absorption deviations (filled: H < 10) | |||||||||||||||||||||||
| 0 | 0 |
|
|
|
|
|
|
| IPAIR | NAME | SHIFT | NEWSHIFT | S/N | NAME | SHIFT | NEWSHIFT | S/N |
| 0 | 08190016 | 0.503900 | 0.00000 | 19.1903 | 08190017 | -0.00199702 | 0.505897 | 19.1646 |
| 1 | 08190012 | 0.502223 | 0.00167698 | 19.2156 | 08190013 | -0.00254653 | 0.506447 | 19.2250 |
| 2 | 08190011 | 0.495082 | 0.00881800 | 19.2145 | 08190014 | -0.00581694 | 0.509717 | 19.2119 |
| 3 | 08190015 | 0.499429 | 0.00447100 | 19.2017 | 08190010 | 0.00000 | 0.503900 | 19.2013 |