| Red | Green | Blue | |
| z | 17.64 | ||
| znorm | Inf | ||
| sky | -Inf | -Inf | -Inf |
| S/N | 32.5 | 51.0 | 58.5 |
| S/N(c) | 0.0 | 0.0 | 0.0 |
| SN(E/C) |
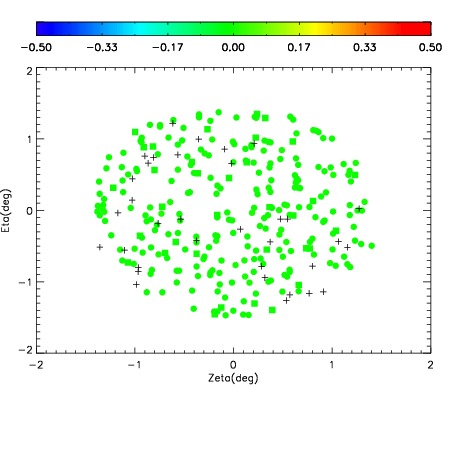
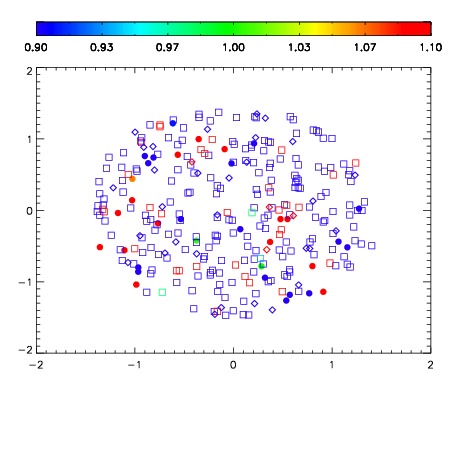
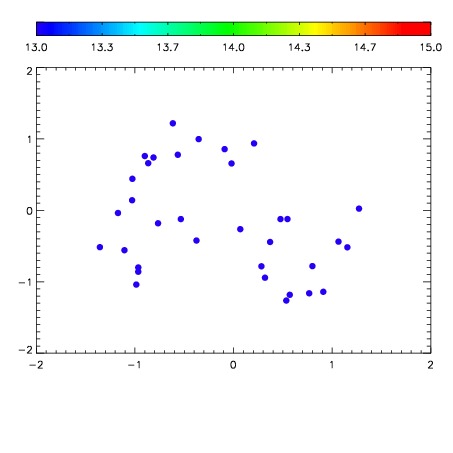

| Frame | Nreads | Zeropoints | Mag plots | Spatial mag deviation | Spatial sky 16325A emission deviations (filled: sky, open: star) | Spatial sky continuum emission | Spatial sky telluric CO2 absorption deviations (filled: H < 10) | |||||||||||||||||||||||
| 0 | 0 |
|
|
|
|
|
|
| IPAIR | NAME | SHIFT | NEWSHIFT | S/N | NAME | SHIFT | NEWSHIFT | S/N |
| 0 | 07500085 | 0.472175 | 0.00000 | 19.1854 | 07500087 | 0.00154318 | 0.470632 | 19.1903 |
| 1 | 07500084 | 0.471229 | 0.000946015 | 19.1707 | 07500086 | 0.00203628 | 0.470139 | 19.1832 |
| 2 | 07500088 | 0.471660 | 0.000515014 | 19.1604 | 07500082 | 0.000869209 | 0.471306 | 19.1620 |
| 3 | 07500081 | 0.470506 | 0.00166899 | 19.1345 | 07500083 | 0.00206118 | 0.470114 | 19.1522 |
| 4 | 07500080 | 0.469111 | 0.00306401 | 19.0990 | 07500079 | 0.00000 | 0.472175 | 19.0697 |