| Red | Green | Blue | |
| z | 17.64 | ||
| znorm | Inf | ||
| sky | -Inf | -Inf | -Inf |
| S/N | 29.6 | 49.4 | 54.7 |
| S/N(c) | 0.0 | 0.0 | 0.0 |
| SN(E/C) |
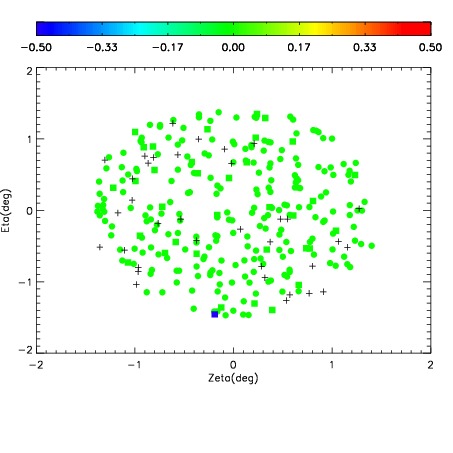
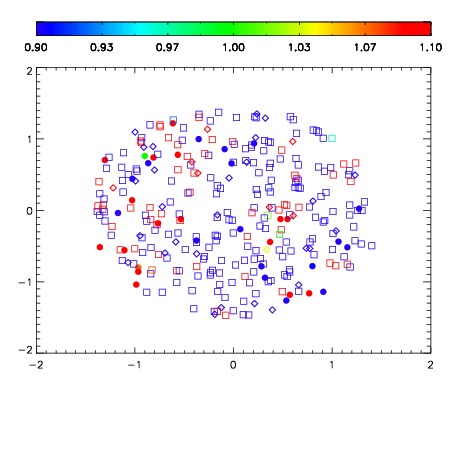
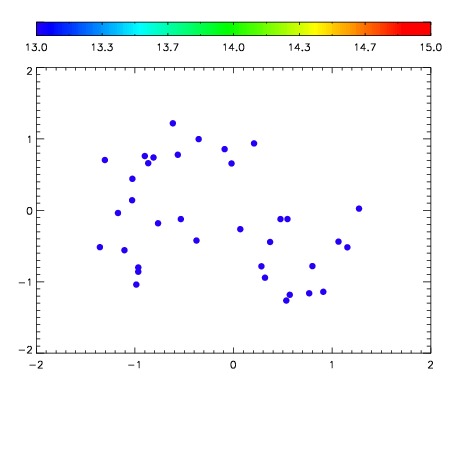

| Frame | Nreads | Zeropoints | Mag plots | Spatial mag deviation | Spatial sky 16325A emission deviations (filled: sky, open: star) | Spatial sky continuum emission | Spatial sky telluric CO2 absorption deviations (filled: H < 10) | |||||||||||||||||||||||
| 0 | 0 |
|
|
|
|
|
|
| IPAIR | NAME | SHIFT | NEWSHIFT | S/N | NAME | SHIFT | NEWSHIFT | S/N |
| 0 | 07540076 | 0.475140 | 0.00000 | 19.2761 | 07540081 | 0.000523009 | 0.474617 | 19.2652 |
| 1 | 07540079 | 0.474425 | 0.000715017 | 19.2655 | 07540077 | 0.00142957 | 0.473710 | 19.2561 |
| 2 | 07540075 | 0.474329 | 0.000811011 | 19.2652 | 07540078 | -0.00137423 | 0.476514 | 19.2525 |
| 3 | 07540080 | 0.475040 | 0.000100017 | 19.2583 | 07540074 | 0.00000 | 0.475140 | 19.2514 |