| Red | Green | Blue | |
| z | 17.64 | ||
| znorm | Inf | ||
| sky | -NaN | -NaN | -Inf |
| S/N | 24.4 | 42.0 | 45.6 |
| S/N(c) | 0.0 | 0.0 | 0.0 |
| SN(E/C) |
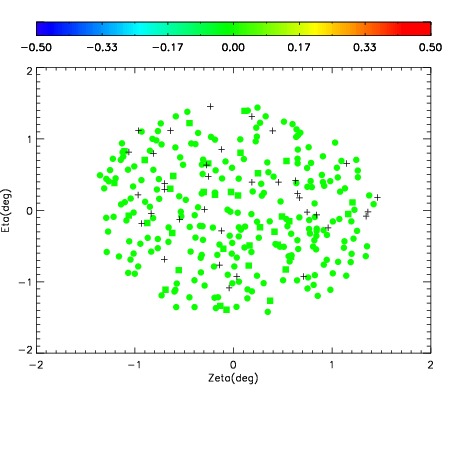
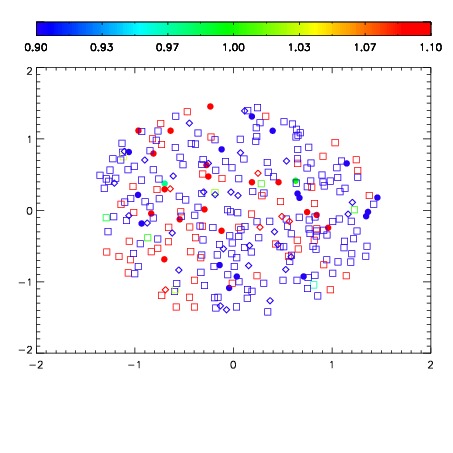


| Frame | Nreads | Zeropoints | Mag plots | Spatial mag deviation | Spatial sky 16325A emission deviations (filled: sky, open: star) | Spatial sky continuum emission | Spatial sky telluric CO2 absorption deviations (filled: H < 10) | |||||||||||||||||||||||
| 0 | 0 |
|
|
|
|
|
|
| IPAIR | NAME | SHIFT | NEWSHIFT | S/N | NAME | SHIFT | NEWSHIFT | S/N |
| 0 | 07220074 | 0.478449 | 0.00000 | 18.6720 | 07220072 | 0.00000 | 0.478449 | 18.1667 |
| 1 | 07220078 | 0.476888 | 0.00156099 | 18.9114 | 07220075 | 0.00262132 | 0.475828 | 18.9195 |
| 2 | 07220077 | 0.476452 | 0.00199699 | 18.8913 | 07220079 | 0.00286732 | 0.475582 | 18.8684 |
| 3 | 07220081 | 0.474289 | 0.00415999 | 18.8399 | 07220080 | 0.00169361 | 0.476755 | 18.8254 |
| 4 | 07220073 | 0.478260 | 0.000188977 | 18.7576 | 07220076 | 0.00250718 | 0.475942 | 18.6213 |