| Frame | Nreads | Zeropoints | Mag plots
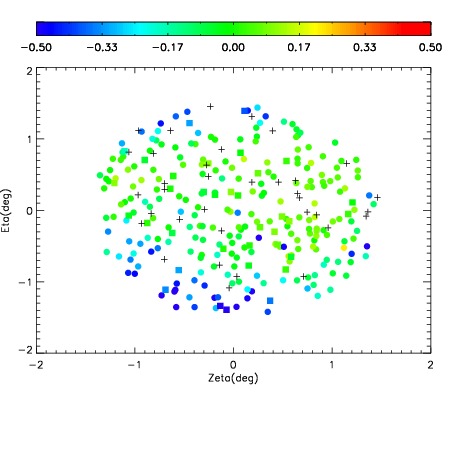
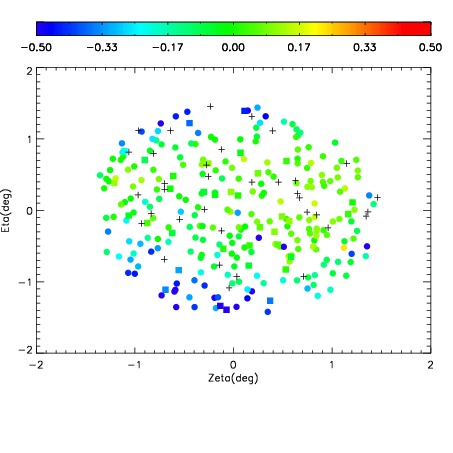
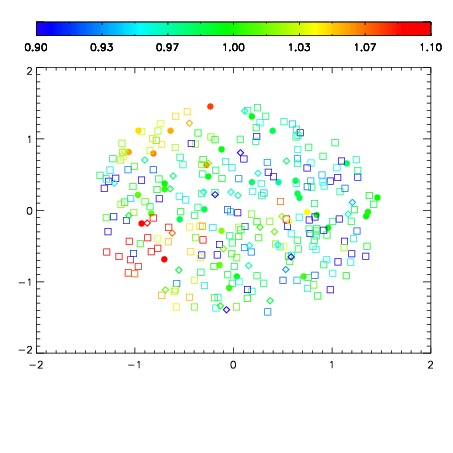
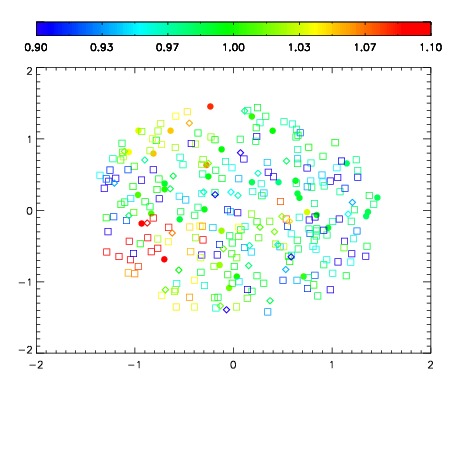
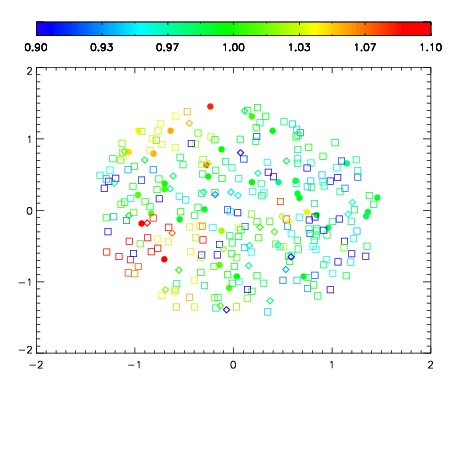
| Spatial mag deviation
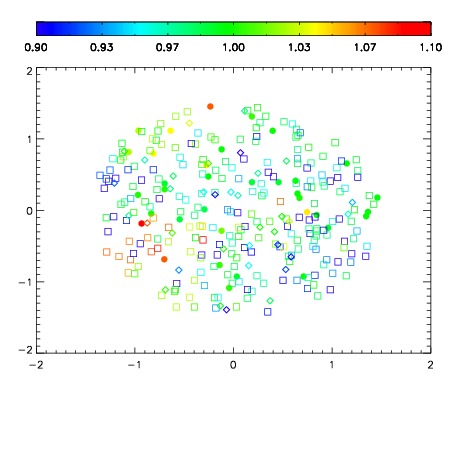
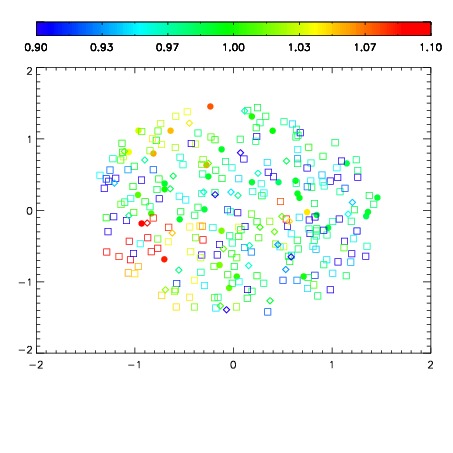
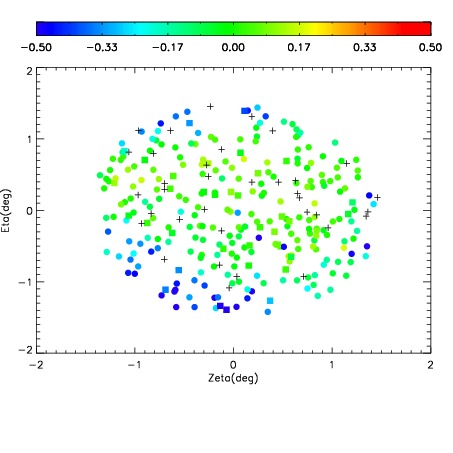
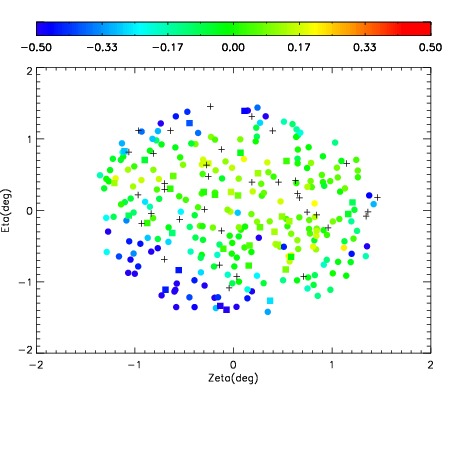
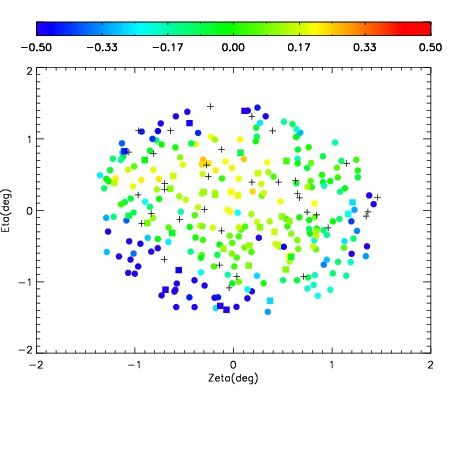
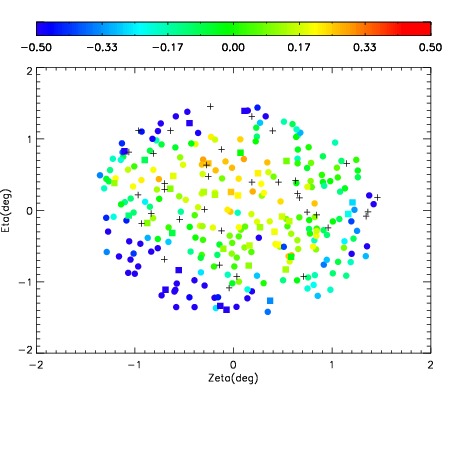
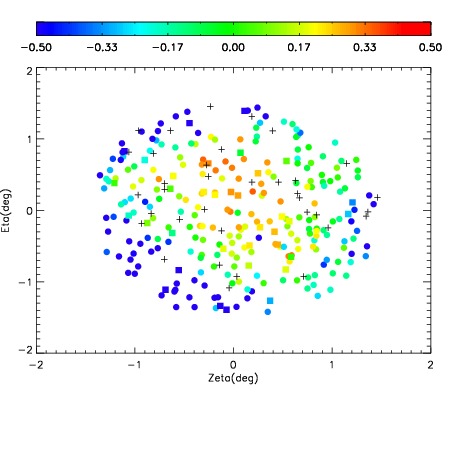
| Spatial sky 16325A emission deviations (filled: sky, open: star)
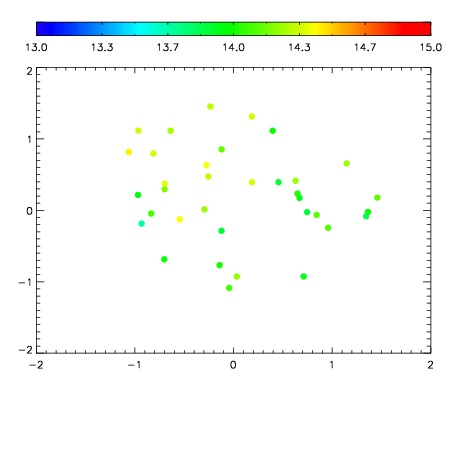
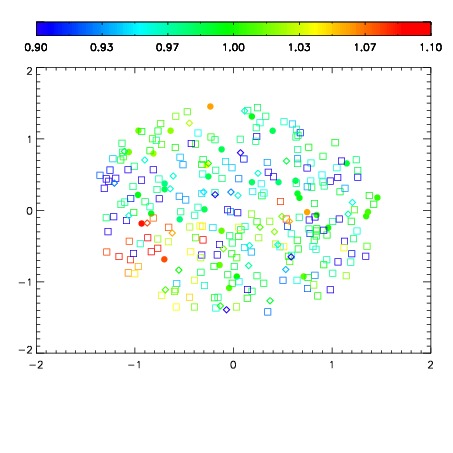
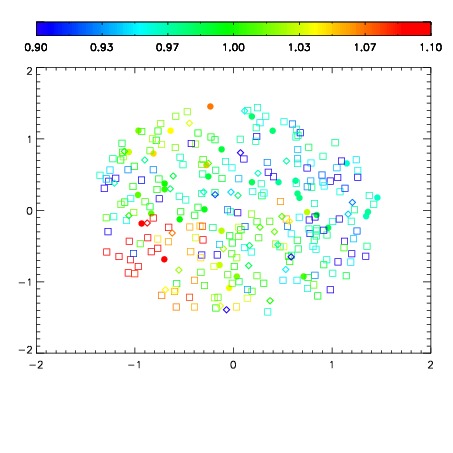
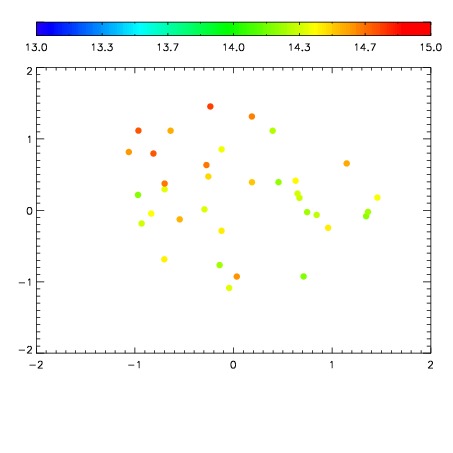
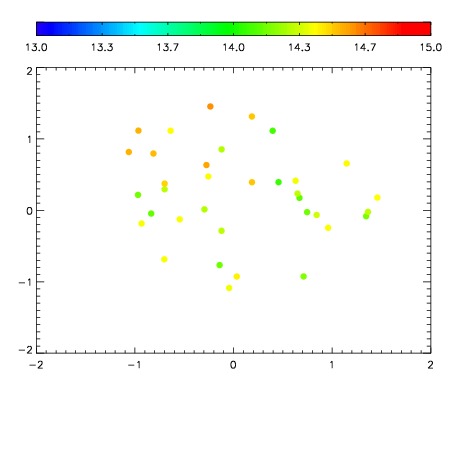
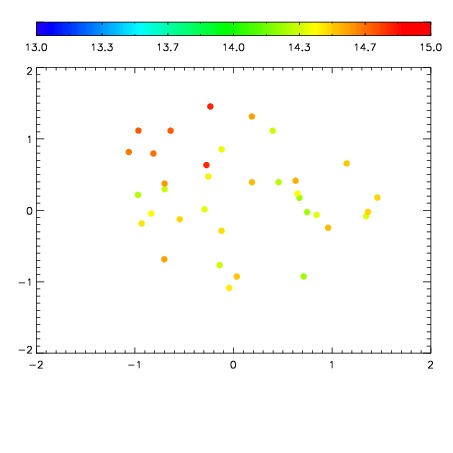
| Spatial sky continuum emission
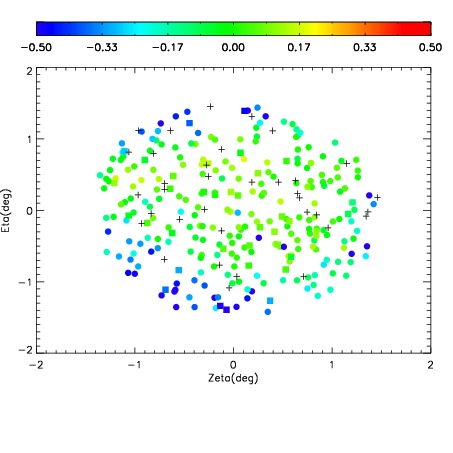
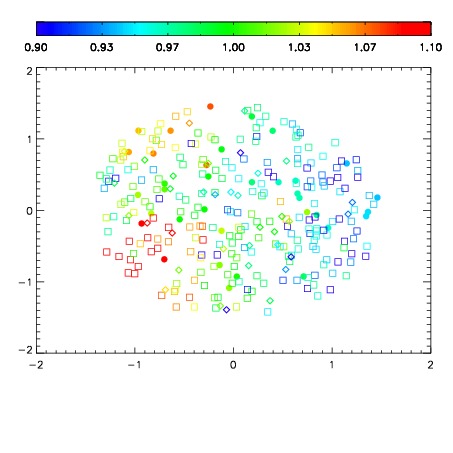
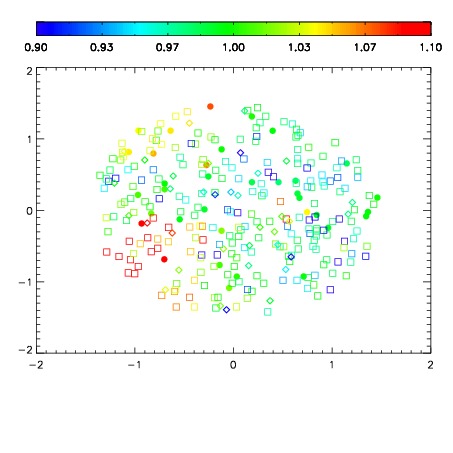
| Spatial sky telluric CO2 absorption deviations (filled: H < 10)
|
| 7280094
| 47
| | Red | Green | Blue
| | z | | 18.88
| | znorm | | 14.70
| | sky | 14.5 | 14.1 | 14.0
| | S/N | 13.5 | 21.9 | 22.8
| | S/N(c) | 15.4 | 19.6 | 11.3
| | SN(E/C) 0.56
|
| 
| 
| 
| 
| 
|
| 7280095
| 47
| | Red | Green | Blue
| | z | | 18.92
| | znorm | | 14.74
| | sky | 14.5 | 14.2 | 14.2
| | S/N | 13.8 | 22.4 | 23.4
| | S/N(c) | 15.6 | 19.9 | 11.7
| | SN(E/C) 0.54
|
| 
| 
| 
| 
| 
|
| 7280096
| 47
| | Red | Green | Blue
| | z | | 18.87
| | znorm | | 14.69
| | sky | 14.6 | 14.2 | 14.2
| | S/N | 13.3 | 21.7 | 22.9
| | S/N(c) | 15.2 | 19.6 | 11.3
| | SN(E/C) 0.54
|
| 
| 
| 
| 
| 
|
| 7280097
| 47
| | Red | Green | Blue
| | z | | 18.89
| | znorm | | 14.71
| | sky | 14.5 | 14.4 | 14.2
| | S/N | 13.5 | 21.8 | 23.0
| | S/N(c) | 15.3 | 19.8 | 11.6
| | SN(E/C) 0.57
|
| 
| 
| 
| 
| 
|
| 7280098
| 47
| | Red | Green | Blue
| | z | | 18.88
| | znorm | | 14.70
| | sky | 14.6 | 14.3 | 14.2
| | S/N | 13.3 | 21.9 | 23.5
| | S/N(c) | 15.3 | 19.7 | 11.4
| | SN(E/C) 0.53
|
| 
| 
| 
| 
| 
|
| 7280099
| 47
| | Red | Green | Blue
| | z | | 18.77
| | znorm | | 14.59
| | sky | 14.6 | 14.3 | 14.3
| | S/N | 12.6 | 21.0 | 22.4
| | S/N(c) | 14.6 | 18.4 | 10.8
| | SN(E/C) 0.61
|
| 
| 
| 
| 
| 
|
| 7280100
| 47
| | Red | Green | Blue
| | z | | 18.77
| | znorm | | 14.59
| | sky | 14.4 | 14.4 | 14.2
| | S/N | 12.5 | 20.9 | 22.6
| | S/N(c) | 14.3 | 18.4 | 10.7
| | SN(E/C) 0.59
|
| 
| 
| 
| 
| 
|
| 7280101
| 47
| | Red | Green | Blue
| | z | | 18.82
| | znorm | | 14.63
| | sky | 14.5 | 14.3 | 14.2
| | S/N | 13.2 | 21.9 | 23.1
| | S/N(c) | 14.7 | 18.9 | 10.8
| | SN(E/C) 0.60
|
| 
| 
| 
| 
| 
|
| 7280102
| 47
| | Red | Green | Blue
| | z | | 18.72
| | znorm | | 14.54
| | sky | 14.5 | 14.4 | 14.3
| | S/N | 12.3 | 21.1 | 22.3
| | S/N(c) | 13.9 | 18.0 | 10.5
| | SN(E/C) 0.62
|
| 
| 
| 
| 
| 
|
| 7280103
| 47
| | Red | Green | Blue
| | z | | 18.60
| | znorm | | 14.42
| | sky | 14.7 | 14.5 | 14.3
| | S/N | 11.3 | 19.6 | 20.5
| | S/N(c) | 13.0 | 17.2 | 9.8
| | SN(E/C) 0.65
|
| 
| 
| 
| 
| 
|