| Red | Green | Blue | |
| z | 17.64 | ||
| znorm | Inf | ||
| sky | -NaN | -NaN | -Inf |
| S/N | 25.0 | 44.0 | 48.6 |
| S/N(c) | 0.0 | 0.0 | 0.0 |
| SN(E/C) |
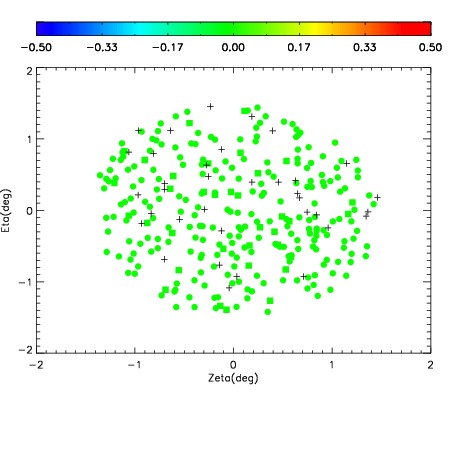
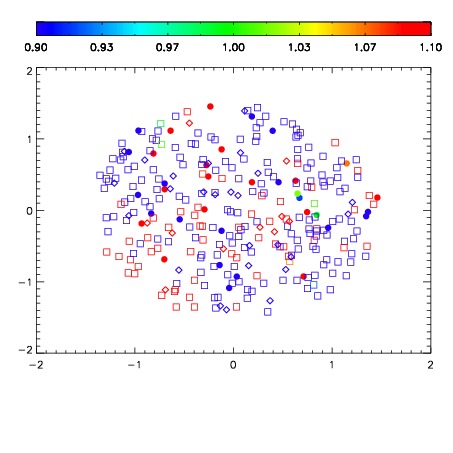


| Frame | Nreads | Zeropoints | Mag plots | Spatial mag deviation | Spatial sky 16325A emission deviations (filled: sky, open: star) | Spatial sky continuum emission | Spatial sky telluric CO2 absorption deviations (filled: H < 10) | |||||||||||||||||||||||
| 0 | 0 |
|
|
|
|
|
|
| IPAIR | NAME | SHIFT | NEWSHIFT | S/N | NAME | SHIFT | NEWSHIFT | S/N |
| 0 | 07280103 | 0.485303 | 0.00000 | 18.5504 | 07280102 | 0.00218009 | 0.483123 | 18.6915 |
| 1 | 07280095 | 0.481290 | 0.00401300 | 18.9123 | 07280097 | 0.00371473 | 0.481588 | 18.8819 |
| 2 | 07280096 | 0.481840 | 0.00346300 | 18.8666 | 07280098 | 0.00175886 | 0.483544 | 18.8737 |
| 3 | 07280099 | 0.482129 | 0.00317401 | 18.7633 | 07280094 | 0.00000 | 0.485303 | 18.8710 |
| 4 | 07280100 | 0.483295 | 0.00200802 | 18.7546 | 07280101 | 0.00277483 | 0.482528 | 18.7935 |