| Red | Green | Blue | |
| z | 17.64 | ||
| znorm | Inf | ||
| sky | -NaN | -NaN | -Inf |
| S/N | 23.7 | 40.1 | 43.9 |
| S/N(c) | 0.0 | 0.0 | 0.0 |
| SN(E/C) |
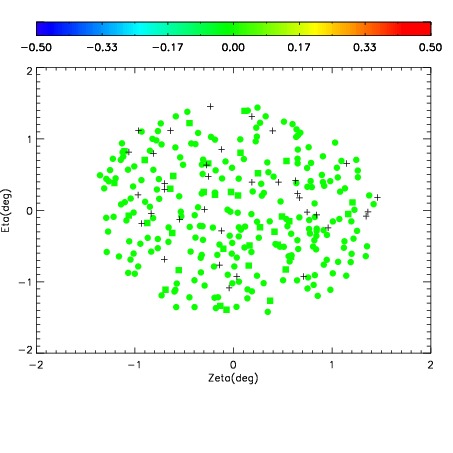
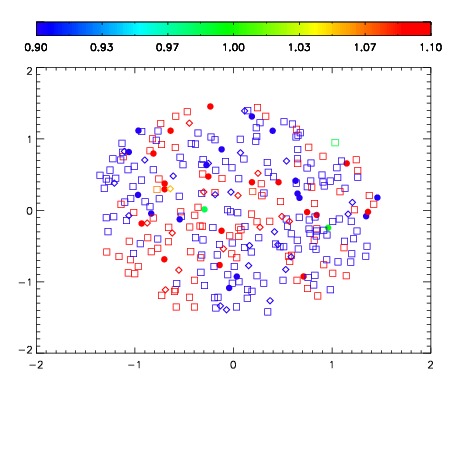
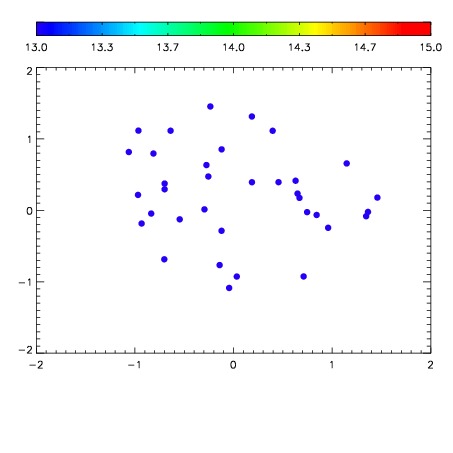

| Frame | Nreads | Zeropoints | Mag plots | Spatial mag deviation | Spatial sky 16325A emission deviations (filled: sky, open: star) | Spatial sky continuum emission | Spatial sky telluric CO2 absorption deviations (filled: H < 10) | |||||||||||||||||||||||
| 0 | 0 |
|
|
|
|
|
|
| IPAIR | NAME | SHIFT | NEWSHIFT | S/N | NAME | SHIFT | NEWSHIFT | S/N |
| 0 | 07530067 | 0.478651 | 0.00000 | 18.8269 | 07530061 | 0.00000 | 0.478651 | 18.8816 |
| 1 | 07530062 | 0.475630 | 0.00302100 | 18.9214 | 07530068 | 0.00349157 | 0.475159 | 18.9012 |
| 2 | 07530063 | 0.477908 | 0.000743002 | 18.8041 | 07530064 | 0.00472863 | 0.473922 | 18.7858 |
| 3 | 07530066 | 0.478321 | 0.000330001 | 18.8002 | 07530065 | 0.00332029 | 0.475331 | 18.7505 |