| Red | Green | Blue | |
| z | 17.64 | ||
| znorm | Inf | ||
| sky | -NaN | -NaN | -Inf |
| S/N | 21.4 | 41.8 | 44.0 |
| S/N(c) | 0.0 | 0.0 | 0.0 |
| SN(E/C) |
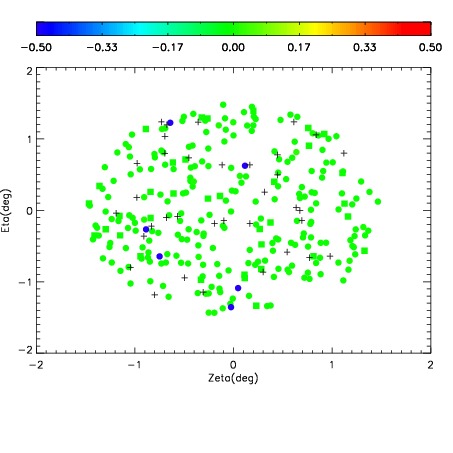
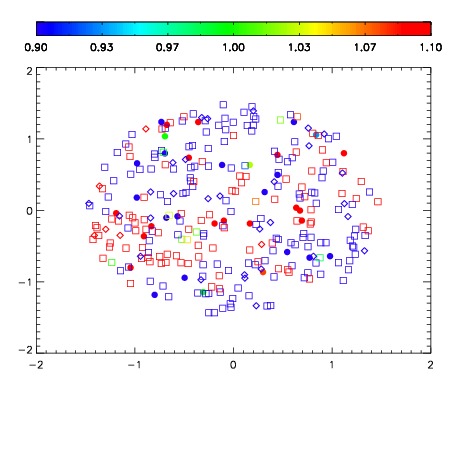
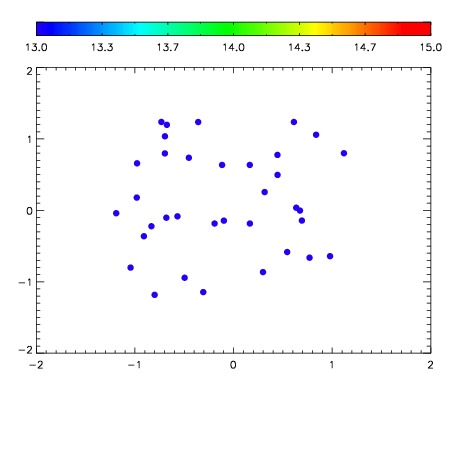

| Frame | Nreads | Zeropoints | Mag plots | Spatial mag deviation | Spatial sky 16325A emission deviations (filled: sky, open: star) | Spatial sky continuum emission | Spatial sky telluric CO2 absorption deviations (filled: H < 10) | |||||||||||||||||||||||
| 0 | 0 |
|
|
|
|
|
|
| IPAIR | NAME | SHIFT | NEWSHIFT | S/N | NAME | SHIFT | NEWSHIFT | S/N |
| 0 | 07260110 | 0.480644 | 0.00000 | 17.8514 | 07260109 | -0.00275198 | 0.483396 | 18.0630 |
| 1 | 07260102 | 0.468836 | 0.0118080 | 18.8678 | 07260105 | -0.00512090 | 0.485765 | 18.8045 |
| 2 | 07260106 | 0.471178 | 0.00946599 | 18.8089 | 07260104 | -0.00317674 | 0.483821 | 18.7787 |
| 3 | 07260103 | 0.468985 | 0.0116590 | 18.7989 | 07260100 | -0.00314623 | 0.483790 | 18.7564 |
| 4 | 07260107 | 0.473196 | 0.00744799 | 18.7883 | 07260101 | -0.00404154 | 0.484686 | 18.7160 |
| 5 | 07260099 | 0.467570 | 0.0130740 | 18.6423 | 07260097 | 0.00000 | 0.480644 | 18.4986 |
| 6 | 07260098 | 0.468042 | 0.0126020 | 18.5121 | 07260108 | -0.000689826 | 0.481334 | 18.4436 |