| Red | Green | Blue | |
| z | 17.64 | ||
| znorm | Inf | ||
| sky | -Inf | -Inf | -Inf |
| S/N | 20.1 | 38.0 | 40.4 |
| S/N(c) | 0.0 | 0.0 | 0.0 |
| SN(E/C) |
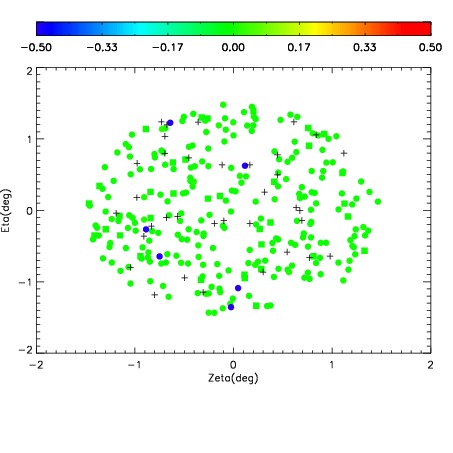
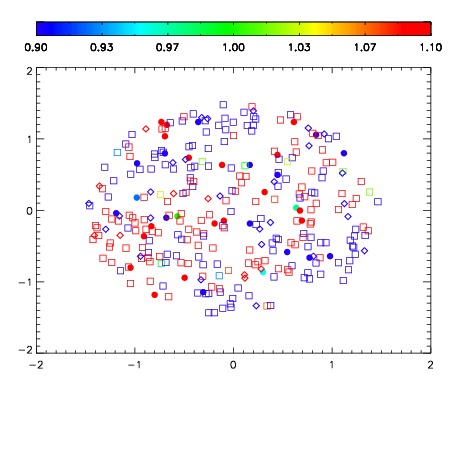
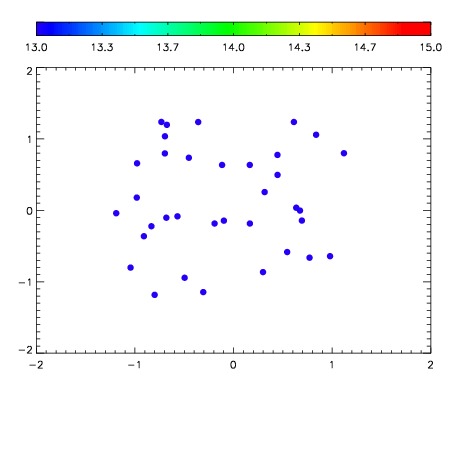

| Frame | Nreads | Zeropoints | Mag plots | Spatial mag deviation | Spatial sky 16325A emission deviations (filled: sky, open: star) | Spatial sky continuum emission | Spatial sky telluric CO2 absorption deviations (filled: H < 10) | |||||||||||||||||||||||
| 0 | 0 |
|
|
|
|
|
|
| IPAIR | NAME | SHIFT | NEWSHIFT | S/N | NAME | SHIFT | NEWSHIFT | S/N |
| 0 | 07510079 | 0.474788 | 0.00000 | 18.7312 | 07510076 | 0.00226521 | 0.472523 | 18.7175 |
| 1 | 07510074 | 0.471896 | 0.00289202 | 18.7921 | 07510073 | 0.00000 | 0.474788 | 18.8818 |
| 2 | 07510078 | 0.473554 | 0.00123402 | 18.7812 | 07510080 | 0.00458866 | 0.470199 | 18.8667 |
| 3 | 07510075 | 0.473085 | 0.00170302 | 18.7732 | 07510077 | 0.00124607 | 0.473542 | 18.8042 |