| Red | Green | Blue | |
| z | 17.64 | ||
| znorm | Inf | ||
| sky | -Inf | -Inf | -Inf |
| S/N | 20.3 | 37.6 | 40.3 |
| S/N(c) | 0.0 | 0.0 | 0.0 |
| SN(E/C) |
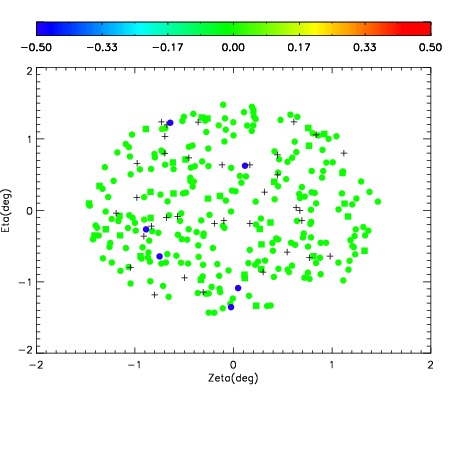
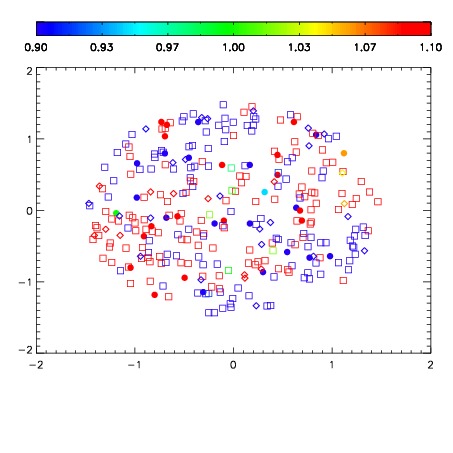
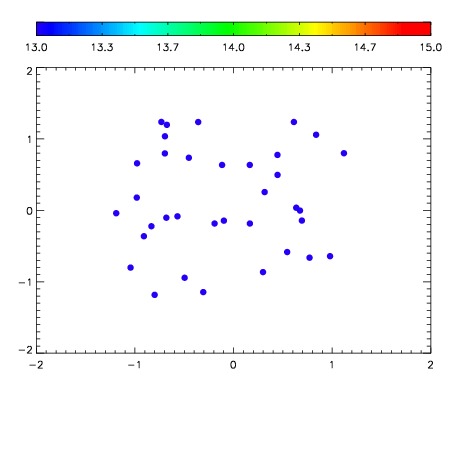

| Frame | Nreads | Zeropoints | Mag plots | Spatial mag deviation | Spatial sky 16325A emission deviations (filled: sky, open: star) | Spatial sky continuum emission | Spatial sky telluric CO2 absorption deviations (filled: H < 10) | |||||||||||||||||||||||
| 0 | 0 |
|
|
|
|
|
|
| IPAIR | NAME | SHIFT | NEWSHIFT | S/N | NAME | SHIFT | NEWSHIFT | S/N |
| 0 | 07520067 | 0.470374 | 0.00000 | 18.7865 | 07520065 | 0.00000 | 0.470374 | 18.7802 |
| 1 | 07520071 | 0.469854 | 0.000519991 | 18.9596 | 07520072 | 0.00407165 | 0.466302 | 18.9044 |
| 2 | 07520070 | 0.469436 | 0.000937998 | 18.9190 | 07520069 | 0.000454257 | 0.469920 | 18.8651 |
| 3 | 07520066 | 0.470157 | 0.000216991 | 18.7996 | 07520068 | 0.00323751 | 0.467136 | 18.8581 |