| Frame | Nreads | Zeropoints | Mag plots
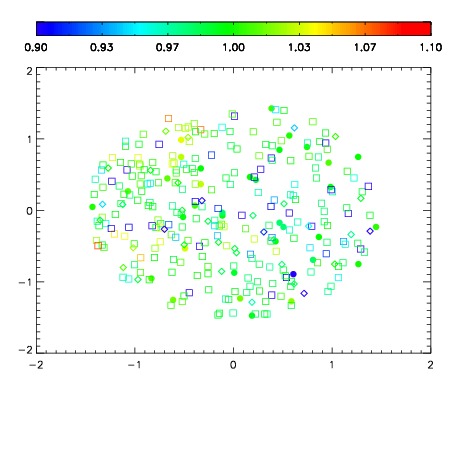
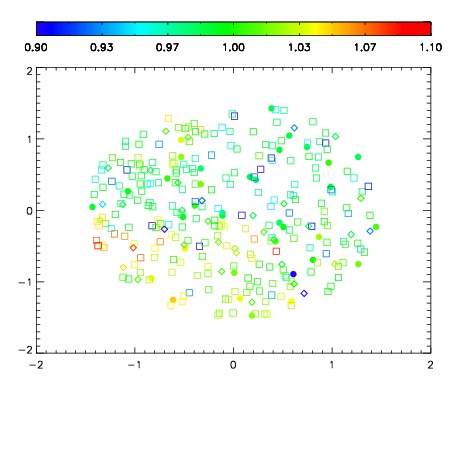
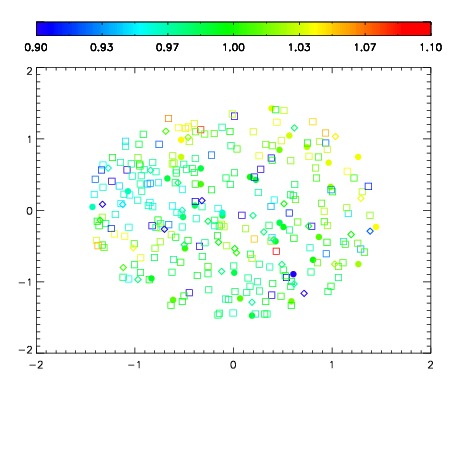
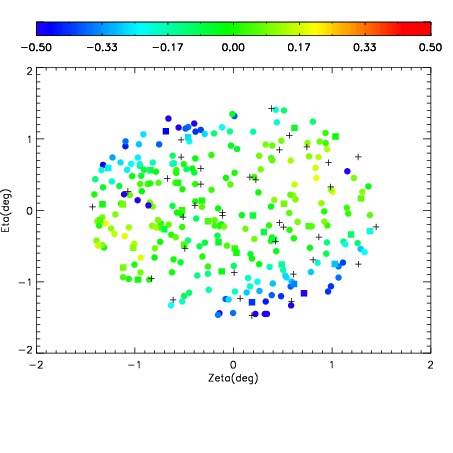
| Spatial mag deviation
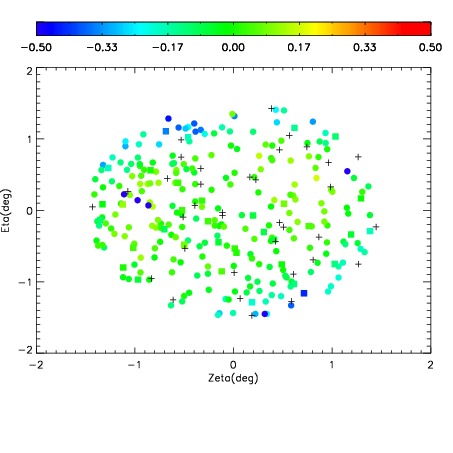
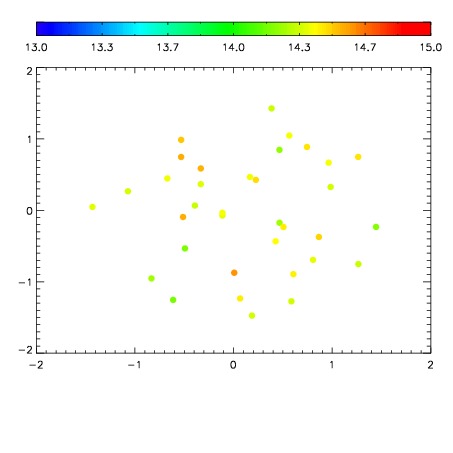
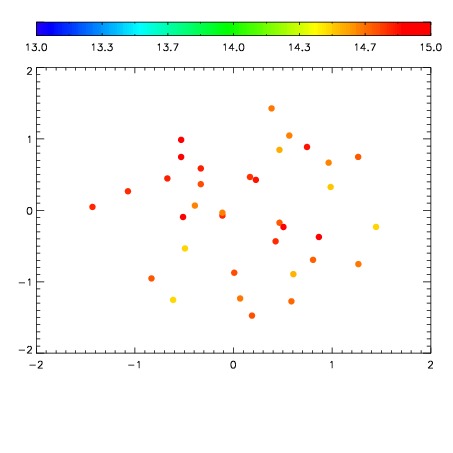
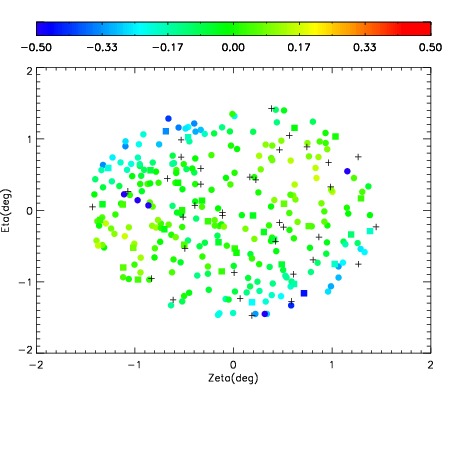
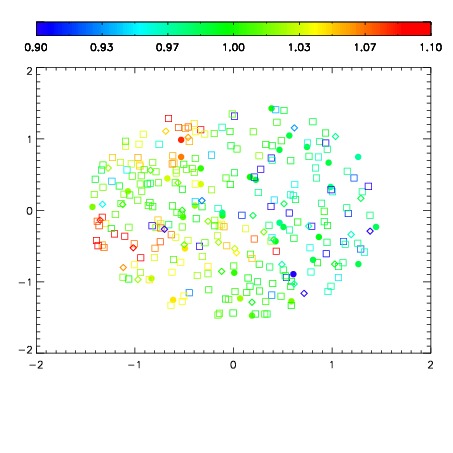
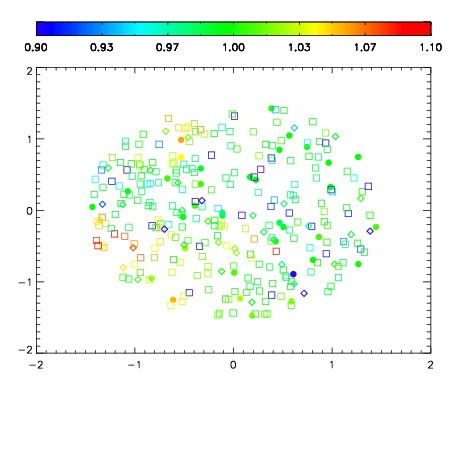
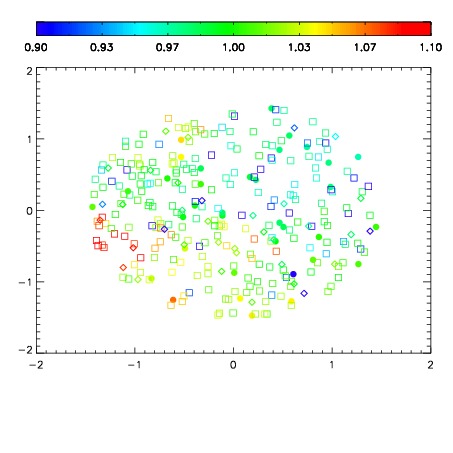
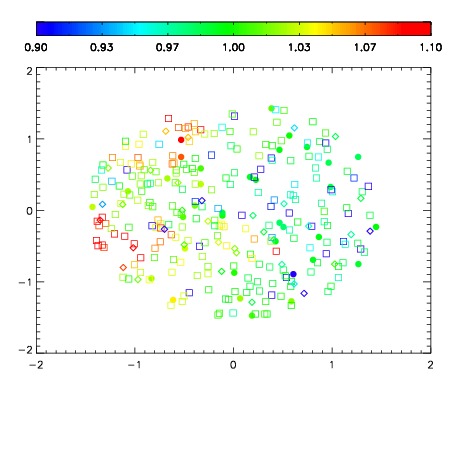
| Spatial sky 16325A emission deviations (filled: sky, open: star)
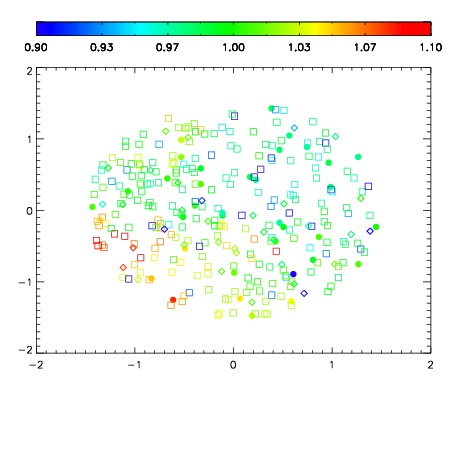
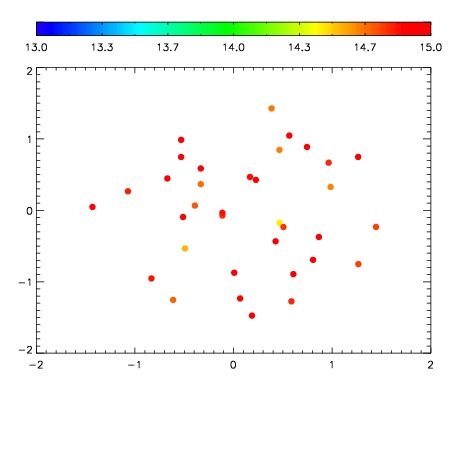
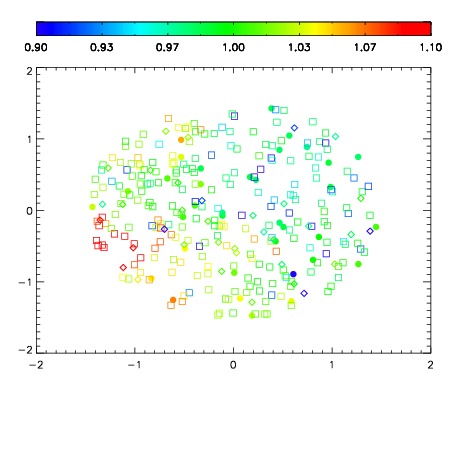
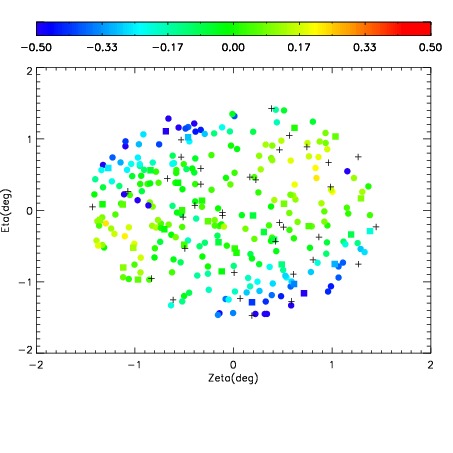
| Spatial sky continuum emission
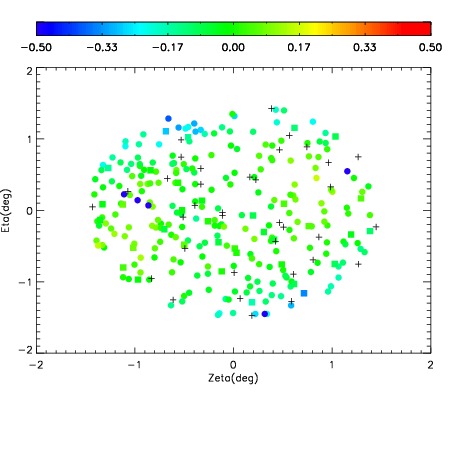
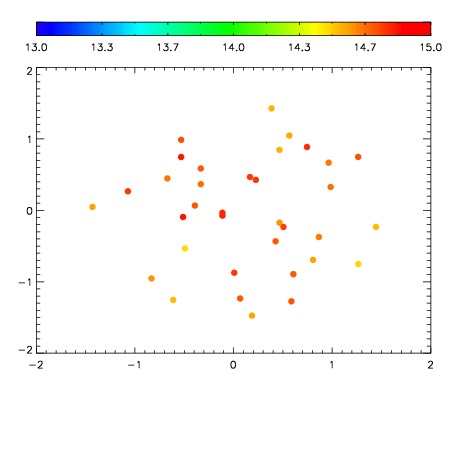
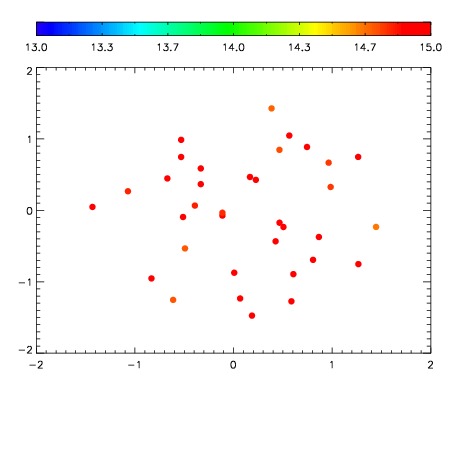
| Spatial sky telluric CO2 absorption deviations (filled: H < 10)
|
| 7280081
| 47
| | Red | Green | Blue
| | z | | 18.56
| | znorm | | 14.38
| | sky | 14.8 | 14.4 | 14.3
| | S/N | 10.2 | 18.3 | 18.3
| | S/N(c) | 26.9 | 23.3 | 10.1
| | SN(E/C) 0.88
|
| 
| 
| 
| 
| 
|
| 7280082
| 47
| | Red | Green | Blue
| | z | | 18.16
| | znorm | | 13.98
| | sky | 15.3 | 14.7 | 14.9
| | S/N | 8.0 | 14.5 | 14.6
| | S/N(c) | 20.7 | 18.8 | 8.1
| | SN(E/C) 0.89
|
| 
| 
| 
| 
| 
|
| 7280083
| 47
| | Red | Green | Blue
| | z | | 18.18
| | znorm | | 14.00
| | sky | 14.8 | 14.7 | 14.9
| | S/N | 7.9 | 14.3 | 14.3
| | S/N(c) | 21.0 | 19.1 | 8.3
| | SN(E/C) 0.83
|
| 
| 
| 
| 
| 
|
| 7280084
| 47
| | Red | Green | Blue
| | z | | 18.35
| | znorm | | 14.17
| | sky | 15.0 | 14.9 | 14.8
| | S/N | 8.7 | 15.9 | 16.5
| | S/N(c) | 23.3 | 20.8 | 9.0
| | SN(E/C) 0.88
|
| 
| 
| 
| 
| 
|
| 7280085
| 47
| | Red | Green | Blue
| | z | | 18.33
| | znorm | | 14.15
| | sky | 14.9 | 14.7 | 14.8
| | S/N | 8.5 | 15.4 | 15.7
| | S/N(c) | 23.2 | 21.0 | 9.0
| | SN(E/C) 0.88
|
| 
| 
| 
| 
| 
|
| 7280086
| 47
| | Red | Green | Blue
| | z | | 18.39
| | znorm | | 14.21
| | sky | 14.8 | 15.0 | 14.7
| | S/N | 8.8 | 16.4 | 16.6
| | S/N(c) | 23.6 | 21.5 | 9.3
| | SN(E/C) 0.86
|
| 
| 
| 
| 
| 
|
| 7280087
| 47
| | Red | Green | Blue
| | z | | 18.64
| | znorm | | 14.46
| | sky | 14.8 | 14.6 | 14.6
| | S/N | 10.3 | 18.4 | 19.0
| | S/N(c) | 27.4 | 23.8 | 10.5
| | SN(E/C) 0.82
|
| 
| 
| 
| 
| 
|
| 7280088
| 47
| | Red | Green | Blue
| | z | | 18.62
| | znorm | | 14.44
| | sky | 14.7 | 14.7 | 14.6
| | S/N | 10.1 | 18.2 | 19.2
| | S/N(c) | 27.2 | 23.7 | 10.6
| | SN(E/C) 0.90
|
| 
| 
| 
| 
| 
|
| 7280089
| 47
| | Red | Green | Blue
| | z | | 18.74
| | znorm | | 14.56
| | sky | 14.7 | 14.6 | 14.5
| | S/N | 10.8 | 19.0 | 20.2
| | S/N(c) | 29.1 | 24.6 | 11.1
| | SN(E/C) 0.83
|
| 
| 
| 
| 
| 
|
| 7280090
| 47
| | Red | Green | Blue
| | z | | 18.79
| | znorm | | 14.61
| | sky | 14.8 | 14.7 | 14.5
| | S/N | 11.3 | 19.6 | 20.6
| | S/N(c) | 29.9 | 25.4 | 11.3
| | SN(E/C) 0.82
|
| 
| 
| 
| 
| 
|