| Red | Green | Blue | |
| z | 17.64 | ||
| znorm | Inf | ||
| sky | -Inf | -Inf | -Inf |
| S/N | 18.9 | 35.7 | 37.0 |
| S/N(c) | 0.0 | 0.0 | 0.0 |
| SN(E/C) |
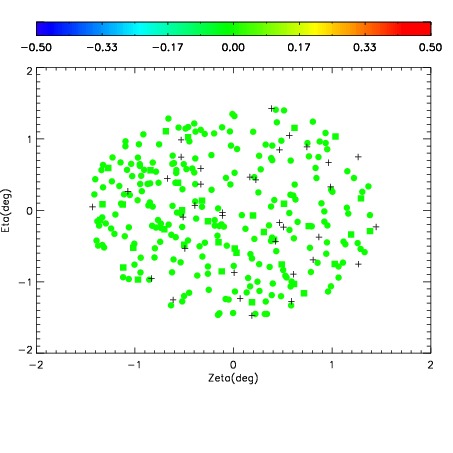
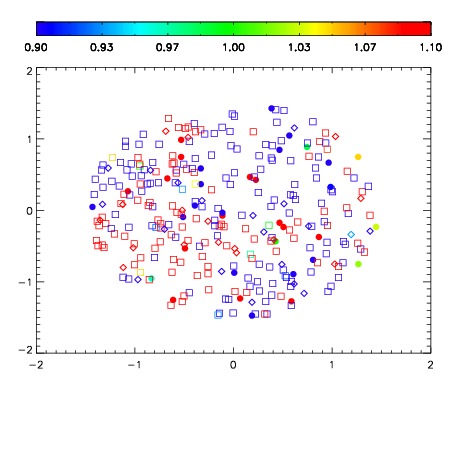


| Frame | Nreads | Zeropoints | Mag plots | Spatial mag deviation | Spatial sky 16325A emission deviations (filled: sky, open: star) | Spatial sky continuum emission | Spatial sky telluric CO2 absorption deviations (filled: H < 10) | |||||||||||||||||||||||
| 0 | 0 |
|
|
|
|
|
|
| IPAIR | NAME | SHIFT | NEWSHIFT | S/N | NAME | SHIFT | NEWSHIFT | S/N |
| 0 | 07280087 | 0.490125 | 0.00000 | 18.6304 | 07280088 | 0.00393430 | 0.486191 | 18.6041 |
| 1 | 07280090 | 0.488387 | 0.00173801 | 18.7655 | 07280089 | 0.00196502 | 0.488160 | 18.7207 |
| 2 | 07280086 | 0.489081 | 0.00104401 | 18.3738 | 07280081 | 0.00000 | 0.490125 | 18.5424 |
| 3 | 07280083 | 0.489589 | 0.000535995 | 18.1739 | 07280084 | 0.00496340 | 0.485162 | 18.3439 |
| 4 | 07280082 | 0.488647 | 0.00147799 | 18.1509 | 07280085 | 0.00241773 | 0.487707 | 18.3188 |