| Red | Green | Blue | |
| z | 17.64 | ||
| znorm | Inf | ||
| sky | -NaN | -NaN | -Inf |
| S/N | 5.5 | 9.9 | 10.9 |
| S/N(c) | 0.0 | 0.0 | 0.0 |
| SN(E/C) |

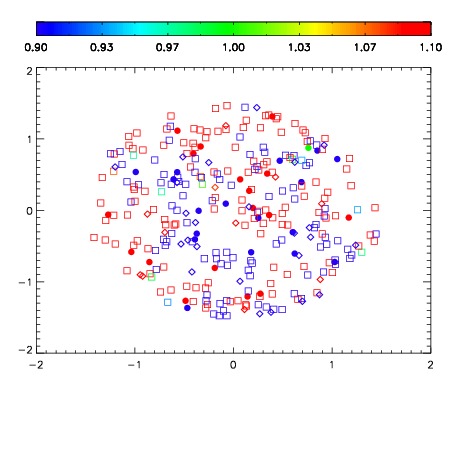
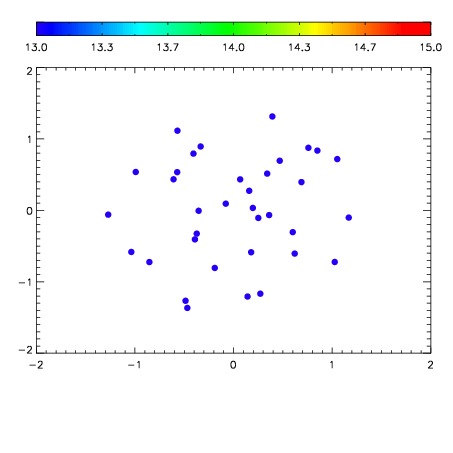

| Frame | Nreads | Zeropoints | Mag plots | Spatial mag deviation | Spatial sky 16325A emission deviations (filled: sky, open: star) | Spatial sky continuum emission | Spatial sky telluric CO2 absorption deviations (filled: H < 10) | |||||||||||||||||||||||
| 0 | 0 |
|
|
|
|
|
|
| IPAIR | NAME | SHIFT | NEWSHIFT | S/N | NAME | SHIFT | NEWSHIFT | S/N |
| 0 | 07290043 | 0.483555 | 0.00000 | 17.2418 | 07290041 | 0.00183287 | 0.481722 | 17.0320 |
| 1 | 07290042 | 0.483473 | 8.19862e-05 | 17.5434 | 07290044 | 0.00130577 | 0.482249 | 17.0665 |
| 2 | 07290039 | 0.482496 | 0.00105900 | 17.2544 | 07290037 | 0.00000 | 0.483555 | 17.0423 |
| 3 | 07290038 | 0.481490 | 0.00206500 | 16.9107 | 07290040 | 0.00198906 | 0.481566 | 17.0193 |