| Red | Green | Blue | |
| z | 17.64 | ||
| znorm | Inf | ||
| sky | -Inf | -Inf | -Inf |
| S/N | 25.5 | 40.5 | 45.7 |
| S/N(c) | 0.0 | 0.0 | 0.0 |
| SN(E/C) |


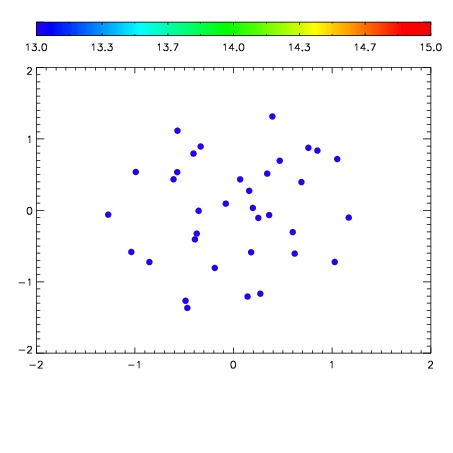

| Frame | Nreads | Zeropoints | Mag plots | Spatial mag deviation | Spatial sky 16325A emission deviations (filled: sky, open: star) | Spatial sky continuum emission | Spatial sky telluric CO2 absorption deviations (filled: H < 10) | |||||||||||||||||||||||
| 0 | 0 |
|
|
|
|
|
|
| IPAIR | NAME | SHIFT | NEWSHIFT | S/N | NAME | SHIFT | NEWSHIFT | S/N |
| 0 | 09970090 | 0.518324 | 0.00000 | 18.8354 | 09970088 | 0.00000 | 0.518324 | 18.7684 |
| 1 | 09970094 | 0.518189 | 0.000135005 | 19.1555 | 09970095 | 0.000250142 | 0.518074 | 19.1216 |
| 2 | 09970093 | 0.517820 | 0.000504017 | 19.0659 | 09970092 | 0.000722414 | 0.517602 | 18.8738 |
| 3 | 09970089 | 0.517216 | 0.00110799 | 18.8394 | 09970091 | 0.00121226 | 0.517112 | 18.8303 |