| Red | Green | Blue | |
| z | 17.64 | ||
| znorm | Inf | ||
| sky | -NaN | -NaN | -Inf |
| S/N | 32.2 | 53.3 | 56.5 |
| S/N(c) | 0.0 | 0.0 | 0.0 |
| SN(E/C) |
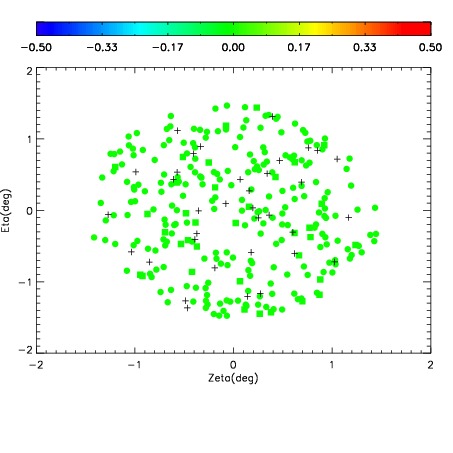

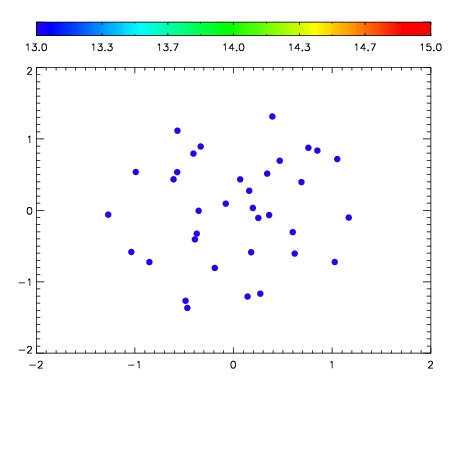

| Frame | Nreads | Zeropoints | Mag plots | Spatial mag deviation | Spatial sky 16325A emission deviations (filled: sky, open: star) | Spatial sky continuum emission | Spatial sky telluric CO2 absorption deviations (filled: H < 10) | |||||||||||||||||||||||
| 0 | 0 |
|
|
|
|
|
|
| IPAIR | NAME | SHIFT | NEWSHIFT | S/N | NAME | SHIFT | NEWSHIFT | S/N |
| 0 | 10200083 | 0.496780 | 0.00000 | 19.1548 | 10200084 | 0.00344423 | 0.493336 | 19.1206 |
| 1 | 10200082 | 0.495268 | 0.00151202 | 19.2147 | 10200088 | 0.00142588 | 0.495354 | 19.1898 |
| 2 | 10200090 | 0.496264 | 0.000515997 | 19.1856 | 10200089 | 0.000801418 | 0.495979 | 19.1881 |
| 3 | 10200087 | 0.494855 | 0.00192502 | 19.1693 | 10200081 | 0.00000 | 0.496780 | 19.1771 |
| 4 | 10200086 | 0.494677 | 0.00210300 | 19.1230 | 10200085 | 0.00333914 | 0.493441 | 19.0610 |