| Red | Green | Blue | |
| z | 17.64 | ||
| znorm | Inf | ||
| sky | -NaN | -NaN | -Inf |
| S/N | 30.3 | 51.1 | 52.0 |
| S/N(c) | 0.0 | 0.0 | 0.0 |
| SN(E/C) |
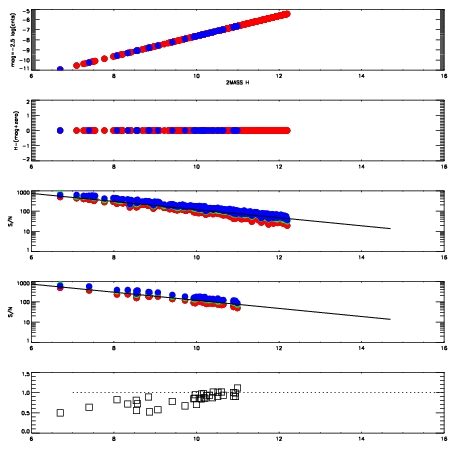
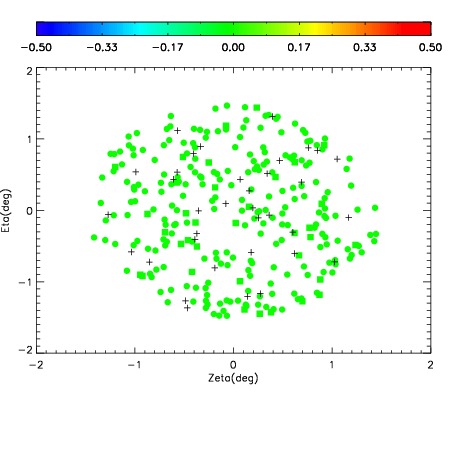

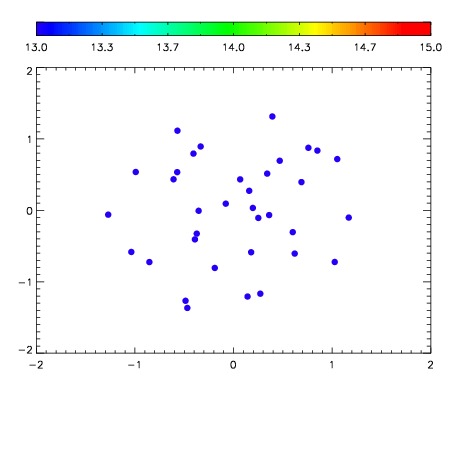

| Frame | Nreads | Zeropoints | Mag plots | Spatial mag deviation | Spatial sky 16325A emission deviations (filled: sky, open: star) | Spatial sky continuum emission | Spatial sky telluric CO2 absorption deviations (filled: H < 10) | |||||||||||||||||||||||
| 0 | 0 |
|
|
|
|
|
|
| IPAIR | NAME | SHIFT | NEWSHIFT | S/N | NAME | SHIFT | NEWSHIFT | S/N |
| 0 | 10240086 | 0.495950 | 0.00000 | 19.1013 | 10240081 | 0.00000 | 0.495950 | 19.1277 |
| 1 | 10240083 | 0.495825 | 0.000125021 | 19.1758 | 10240088 | 0.00443048 | 0.491520 | 19.1914 |
| 2 | 10240082 | 0.495313 | 0.000637025 | 19.1715 | 10240085 | 0.00359496 | 0.492355 | 19.1829 |
| 3 | 10240087 | 0.495308 | 0.000642002 | 19.1413 | 10240084 | 0.00338848 | 0.492562 | 19.1653 |