| Red | Green | Blue | |
| z | 17.64 | ||
| znorm | Inf | ||
| sky | -Inf | -Inf | -Inf |
| S/N | 23.2 | 39.3 | 41.6 |
| S/N(c) | 0.0 | 0.0 | 0.0 |
| SN(E/C) |
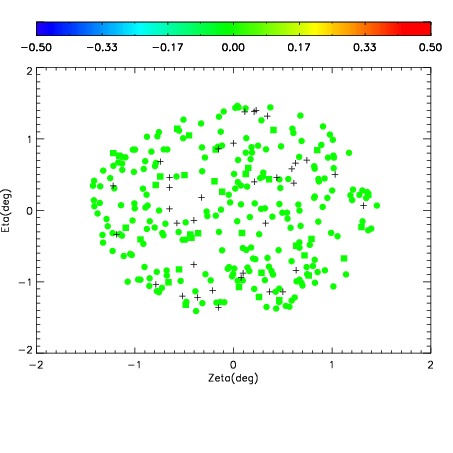
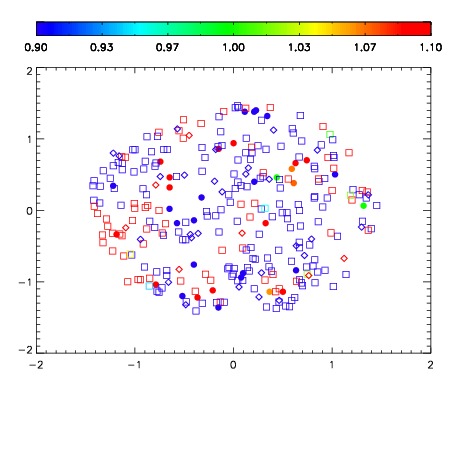
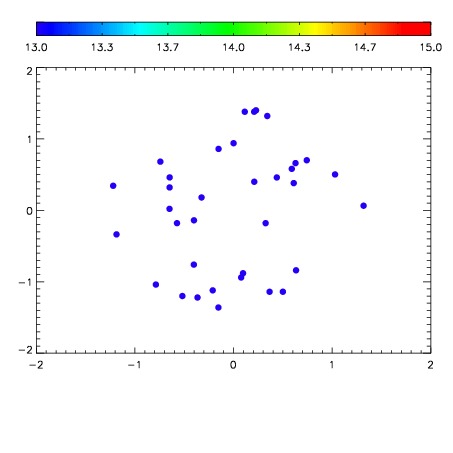

| Frame | Nreads | Zeropoints | Mag plots | Spatial mag deviation | Spatial sky 16325A emission deviations (filled: sky, open: star) | Spatial sky continuum emission | Spatial sky telluric CO2 absorption deviations (filled: H < 10) | |||||||||||||||||||||||
| 0 | 0 |
|
|
|
|
|
|
| IPAIR | NAME | SHIFT | NEWSHIFT | S/N | NAME | SHIFT | NEWSHIFT | S/N |
| 0 | 07230053 | 0.472101 | 0.00000 | 19.0073 | 07230048 | 0.00000 | 0.472101 | 18.8890 |
| 1 | 07230049 | 0.469514 | 0.00258699 | 18.9520 | 07230052 | 0.00117879 | 0.470922 | 18.7718 |
| 2 | 07230050 | 0.470048 | 0.00205299 | 18.8242 | 07230051 | 0.00123766 | 0.470863 | 18.7709 |
| 3 | 07230054 | 0.471760 | 0.000340998 | 18.7955 | 07230055 | 0.00377691 | 0.468324 | 18.6679 |