| Red | Green | Blue | |
| z | 17.64 | ||
| znorm | Inf | ||
| sky | -Inf | -NaN | -Inf |
| S/N | 22.7 | 39.8 | 42.0 |
| S/N(c) | 0.0 | 0.0 | 0.0 |
| SN(E/C) |
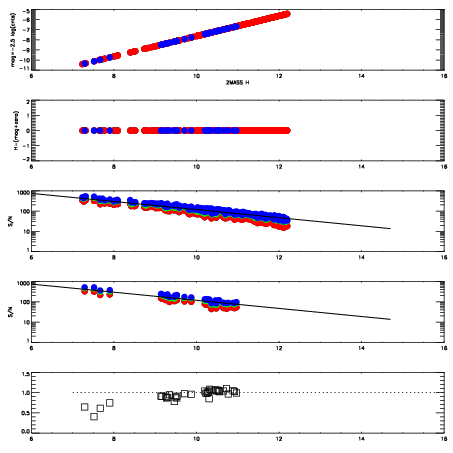


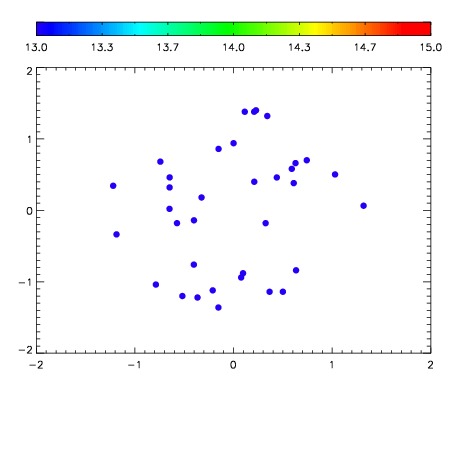

| Frame | Nreads | Zeropoints | Mag plots | Spatial mag deviation | Spatial sky 16325A emission deviations (filled: sky, open: star) | Spatial sky continuum emission | Spatial sky telluric CO2 absorption deviations (filled: H < 10) | |||||||||||||||||||||||
| 0 | 0 |
|
|
|
|
|
|
| IPAIR | NAME | SHIFT | NEWSHIFT | S/N | NAME | SHIFT | NEWSHIFT | S/N |
| 0 | 07520028 | 0.476421 | 0.00000 | 18.8744 | 07520029 | -0.00213427 | 0.478555 | 18.8525 |
| 1 | 07520032 | 0.476366 | 5.49853e-05 | 18.9833 | 07520026 | 0.00000 | 0.476421 | 18.9178 |
| 2 | 07520027 | 0.475887 | 0.000533998 | 18.9282 | 07520033 | 0.000912739 | 0.475508 | 18.8622 |
| 3 | 07520031 | 0.475863 | 0.000557989 | 18.7874 | 07520030 | -0.00157401 | 0.477995 | 18.7642 |