| Red | Green | Blue | |
| z | 17.64 | ||
| znorm | Inf | ||
| sky | -Inf | -Inf | -Inf |
| S/N | 10.4 | 20.1 | 21.4 |
| S/N(c) | 0.0 | 0.0 | 0.0 |
| SN(E/C) |


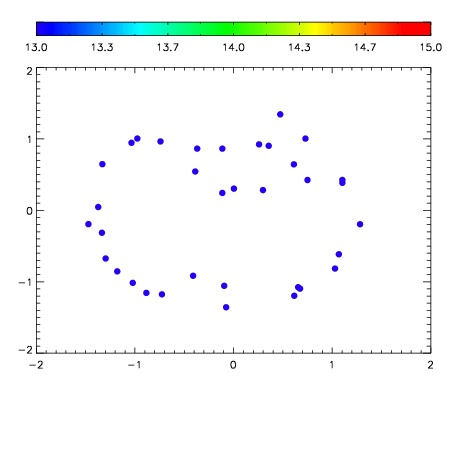

| Frame | Nreads | Zeropoints | Mag plots | Spatial mag deviation | Spatial sky 16325A emission deviations (filled: sky, open: star) | Spatial sky continuum emission | Spatial sky telluric CO2 absorption deviations (filled: H < 10) | |||||||||||||||||||||||
| 0 | 0 |
|
|
|
|
|
|
| IPAIR | NAME | SHIFT | NEWSHIFT | S/N | NAME | SHIFT | NEWSHIFT | S/N |
| 0 | 07220052 | 0.475081 | 0.00000 | 17.7116 | 07220046 | 0.00000 | 0.475081 | 17.5761 |
| 1 | 07220048 | 0.471568 | 0.00351301 | 18.0489 | 07220053 | -0.00253499 | 0.477616 | 18.4557 |
| 2 | 07220047 | 0.471686 | 0.00339499 | 17.8256 | 07220050 | -0.000568870 | 0.475650 | 17.8625 |
| 3 | 07220051 | 0.474117 | 0.000963986 | 17.5208 | 07220049 | 0.00161381 | 0.473467 | 17.4872 |