| Red | Green | Blue | |
| z | 17.64 | ||
| znorm | Inf | ||
| sky | -NaN | -Inf | -Inf |
| S/N | 5.8 | 9.8 | 12.1 |
| S/N(c) | 0.0 | 0.0 | 0.0 |
| SN(E/C) |
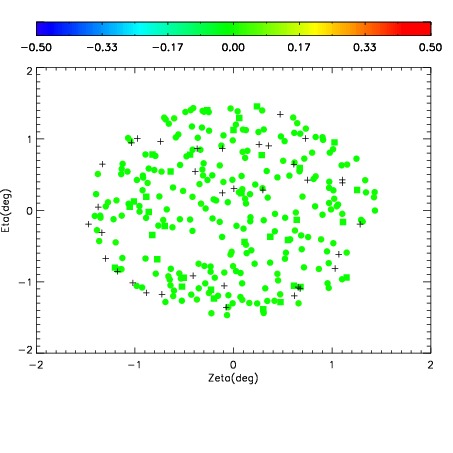
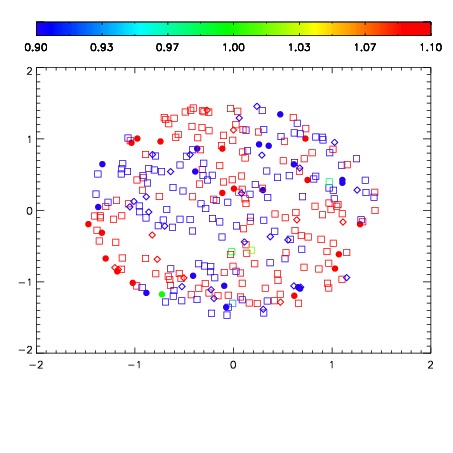
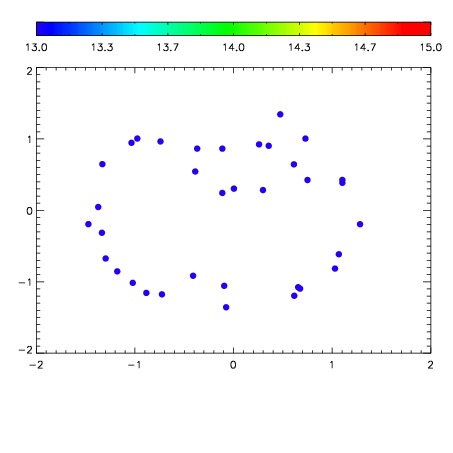

| Frame | Nreads | Zeropoints | Mag plots | Spatial mag deviation | Spatial sky 16325A emission deviations (filled: sky, open: star) | Spatial sky continuum emission | Spatial sky telluric CO2 absorption deviations (filled: H < 10) | |||||||||||||||||||||||
| 0 | 0 |
|
|
|
|
|
|
| IPAIR | NAME | SHIFT | NEWSHIFT | S/N | NAME | SHIFT | NEWSHIFT | S/N |
| 0 | 07290058 | 0.489707 | 0.00000 | 14.6211 | 07290055 | 0.00234330 | 0.487364 | 14.4322 |
| 1 | 07290053 | 0.482698 | 0.00700900 | 17.7124 | 07290052 | -9.71912e-05 | 0.489804 | 18.0050 |
| 2 | 07290050 | 0.482592 | 0.00711501 | 17.1233 | 07290051 | 0.00145729 | 0.488250 | 17.4417 |
| 3 | 07290049 | 0.482480 | 0.00722700 | 16.8680 | 07290056 | 0.00102956 | 0.488677 | 16.9029 |
| 4 | 07290054 | 0.484508 | 0.00519899 | 16.2757 | 07290048 | 0.00000 | 0.489707 | 16.8049 |
| 5 | 07290057 | 0.488821 | 0.000885993 | 16.1327 | 07290059 | 0.00222069 | 0.487486 | 14.8492 |