| Red | Green | Blue | |
| z | 17.64 | ||
| znorm | Inf | ||
| sky | -Inf | -Inf | -Inf |
| S/N | 20.2 | 35.8 | 37.3 |
| S/N(c) | 0.0 | 0.0 | 0.0 |
| SN(E/C) |


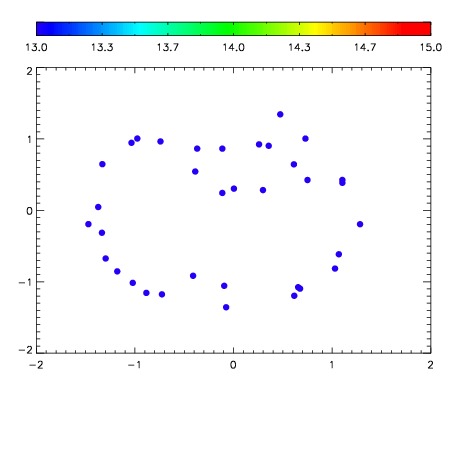

| Frame | Nreads | Zeropoints | Mag plots | Spatial mag deviation | Spatial sky 16325A emission deviations (filled: sky, open: star) | Spatial sky continuum emission | Spatial sky telluric CO2 absorption deviations (filled: H < 10) | |||||||||||||||||||||||
| 0 | 0 |
|
|
|
|
|
|
| IPAIR | NAME | SHIFT | NEWSHIFT | S/N | NAME | SHIFT | NEWSHIFT | S/N |
| 0 | 07510038 | 0.481354 | 0.00000 | 18.6413 | 07510036 | 0.00000 | 0.481354 | 18.7806 |
| 1 | 07510037 | 0.480944 | 0.000409991 | 18.5861 | 07510039 | -0.000968483 | 0.482322 | 18.5892 |
| 2 | 07510041 | 0.467025 | 0.0143290 | 18.5456 | 07510043 | -0.00230656 | 0.483661 | 18.5775 |
| 3 | 07510042 | 0.467326 | 0.0140280 | 18.5198 | 07510040 | -0.00196829 | 0.483322 | 18.5417 |