| Red | Green | Blue | |
| z | 17.64 | ||
| znorm | Inf | ||
| sky | -NaN | -Inf | -Inf |
| S/N | 14.8 | 27.9 | 29.5 |
| S/N(c) | 0.0 | 0.0 | 0.0 |
| SN(E/C) |


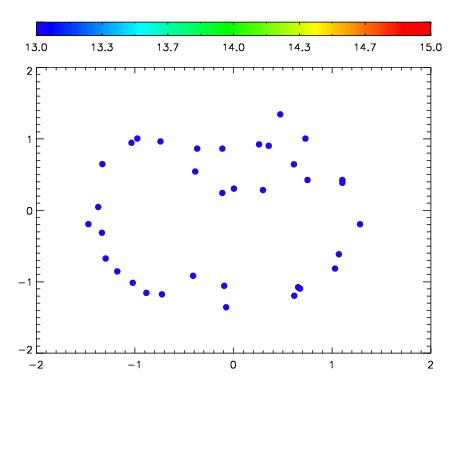

| Frame | Nreads | Zeropoints | Mag plots | Spatial mag deviation | Spatial sky 16325A emission deviations (filled: sky, open: star) | Spatial sky continuum emission | Spatial sky telluric CO2 absorption deviations (filled: H < 10) | |||||||||||||||||||||||
| 0 | 0 |
|
|
|
|
|
|
| IPAIR | NAME | SHIFT | NEWSHIFT | S/N | NAME | SHIFT | NEWSHIFT | S/N |
| 0 | 07880017 | 0.474156 | 0.00000 | 18.3146 | 07880015 | 0.00188657 | 0.472269 | 18.4490 |
| 1 | 07880016 | 0.473437 | 0.000718981 | 18.3547 | 07880014 | -0.000330567 | 0.474487 | 18.4597 |
| 2 | 07880012 | 0.468430 | 0.00572598 | 18.1738 | 07880018 | 0.00337664 | 0.470779 | 18.3414 |
| 3 | 07880013 | 0.468811 | 0.00534499 | 17.8278 | 07880011 | 0.00000 | 0.474156 | 17.6740 |