| Red | Green | Blue | |
| z | 17.64 | ||
| znorm | Inf | ||
| sky | -Inf | -Inf | -Inf |
| S/N | 22.6 | 39.0 | 42.8 |
| S/N(c) | 0.0 | 0.0 | 0.0 |
| SN(E/C) |
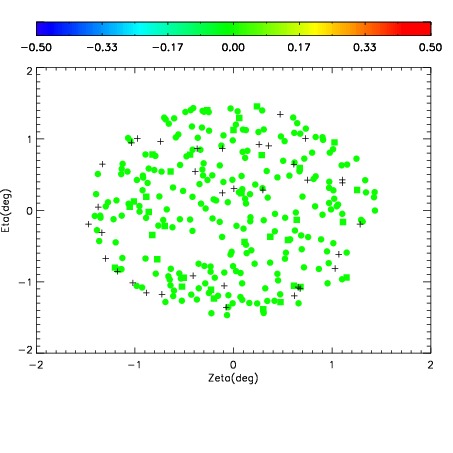

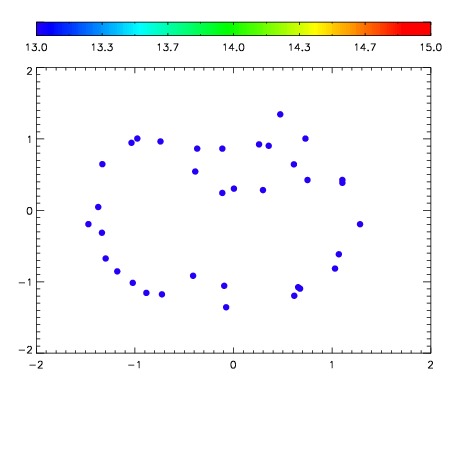

| Frame | Nreads | Zeropoints | Mag plots | Spatial mag deviation | Spatial sky 16325A emission deviations (filled: sky, open: star) | Spatial sky continuum emission | Spatial sky telluric CO2 absorption deviations (filled: H < 10) | |||||||||||||||||||||||
| 0 | 0 |
|
|
|
|
|
|
| IPAIR | NAME | SHIFT | NEWSHIFT | S/N | NAME | SHIFT | NEWSHIFT | S/N |
| 0 | 07890017 | 0.470143 | 0.00000 | 18.7414 | 07890011 | 0.00000 | 0.470143 | 18.7681 |
| 1 | 07890013 | 0.466961 | 0.00318199 | 18.9309 | 07890018 | -7.56662e-05 | 0.470219 | 18.8173 |
| 2 | 07890012 | 0.466517 | 0.00362599 | 18.9022 | 07890015 | -0.000148364 | 0.470291 | 18.7914 |
| 3 | 07890016 | 0.469515 | 0.000627995 | 18.6586 | 07890014 | -0.000471048 | 0.470614 | 18.7014 |