| Red | Green | Blue | |
| z | 17.64 | ||
| znorm | Inf | ||
| sky | -Inf | -Inf | -Inf |
| S/N | 26.8 | 44.5 | 48.4 |
| S/N(c) | 0.0 | 0.0 | 0.0 |
| SN(E/C) |


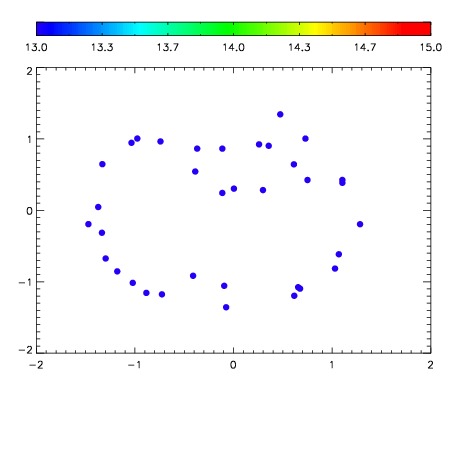

| Frame | Nreads | Zeropoints | Mag plots | Spatial mag deviation | Spatial sky 16325A emission deviations (filled: sky, open: star) | Spatial sky continuum emission | Spatial sky telluric CO2 absorption deviations (filled: H < 10) | |||||||||||||||||||||||
| 0 | 0 |
|
|
|
|
|
|
| IPAIR | NAME | SHIFT | NEWSHIFT | S/N | NAME | SHIFT | NEWSHIFT | S/N |
| 0 | 10230090 | 0.500272 | 0.00000 | 19.0949 | 10230091 | 0.00518017 | 0.495092 | 19.1323 |
| 1 | 10230089 | 0.499770 | 0.000501990 | 19.0737 | 10230088 | 0.00403682 | 0.496235 | 19.0603 |
| 2 | 10230085 | 0.499429 | 0.000842988 | 19.0306 | 10230087 | 0.00458552 | 0.495686 | 19.0012 |
| 3 | 10230086 | 0.499730 | 0.000541985 | 18.9706 | 10230084 | 0.00000 | 0.500272 | 18.9986 |