| Red | Green | Blue | |
| z | 17.64 | ||
| znorm | Inf | ||
| sky | -NaN | -NaN | -Inf |
| S/N | 18.7 | 32.8 | 36.0 |
| S/N(c) | 0.0 | 0.0 | 0.0 |
| SN(E/C) |
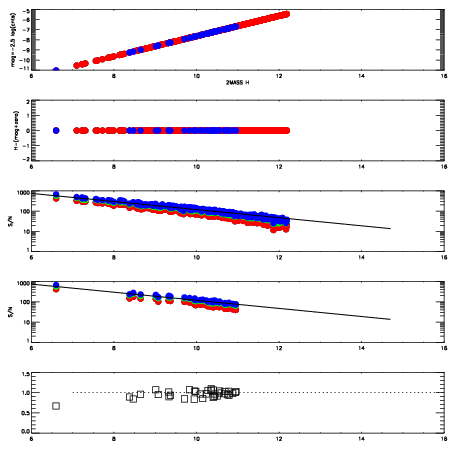
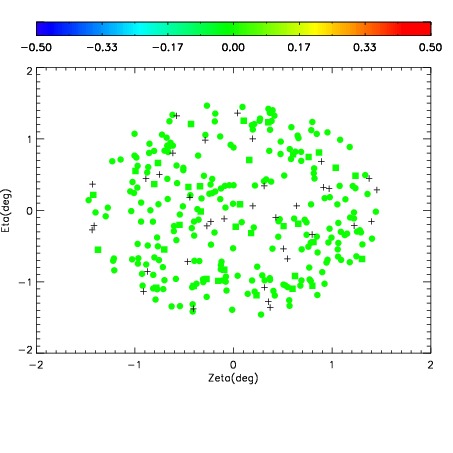
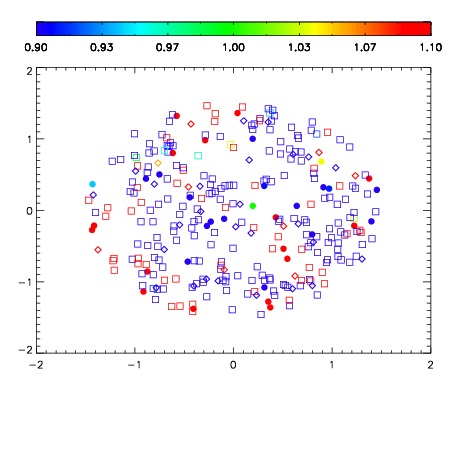
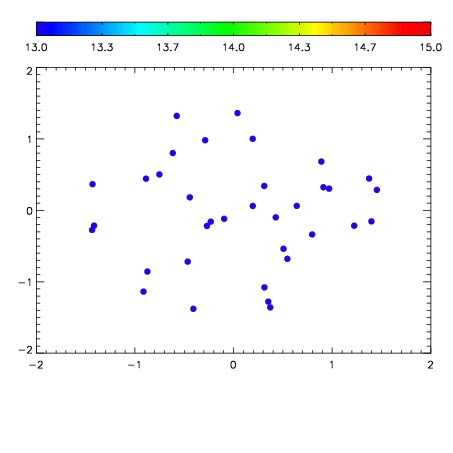

| Frame | Nreads | Zeropoints | Mag plots | Spatial mag deviation | Spatial sky 16325A emission deviations (filled: sky, open: star) | Spatial sky continuum emission | Spatial sky telluric CO2 absorption deviations (filled: H < 10) | |||||||||||||||||||||||
| 0 | 0 |
|
|
|
|
|
|
| IPAIR | NAME | SHIFT | NEWSHIFT | S/N | NAME | SHIFT | NEWSHIFT | S/N |
| 0 | 07260059 | 0.474060 | 0.00000 | 18.6482 | 07260053 | 0.00000 | 0.474060 | 18.4468 |
| 1 | 07260058 | 0.472713 | 0.00134701 | 18.7585 | 07260057 | -0.00273290 | 0.476793 | 18.7415 |
| 2 | 07260055 | 0.471844 | 0.00221601 | 18.7329 | 07260056 | 0.00131643 | 0.472744 | 18.7080 |
| 3 | 07260054 | 0.471226 | 0.00283399 | 18.5955 | 07260060 | 0.000368027 | 0.473692 | 18.3933 |