| Red | Green | Blue | |
| z | 17.64 | ||
| znorm | Inf | ||
| sky | -NaN | -NaN | -Inf |
| S/N | 23.9 | 41.8 | 46.3 |
| S/N(c) | 0.0 | 0.0 | 0.0 |
| SN(E/C) |


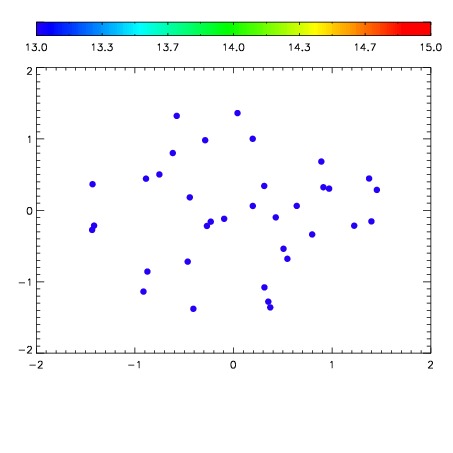

| Frame | Nreads | Zeropoints | Mag plots | Spatial mag deviation | Spatial sky 16325A emission deviations (filled: sky, open: star) | Spatial sky continuum emission | Spatial sky telluric CO2 absorption deviations (filled: H < 10) | |||||||||||||||||||||||
| 0 | 0 |
|
|
|
|
|
|
| IPAIR | NAME | SHIFT | NEWSHIFT | S/N | NAME | SHIFT | NEWSHIFT | S/N |
| 0 | 07520043 | 0.474364 | 0.00000 | 18.8943 | 07520044 | -0.000701753 | 0.475066 | 18.9304 |
| 1 | 07520039 | 0.471817 | 0.00254703 | 18.9771 | 07520041 | -0.00258931 | 0.476953 | 18.9701 |
| 2 | 07520042 | 0.473266 | 0.00109801 | 18.9762 | 07520040 | 0.000259727 | 0.474104 | 18.9361 |
| 3 | 07520038 | 0.471433 | 0.00293100 | 18.7959 | 07520037 | 0.00000 | 0.474364 | 18.7891 |