| Red | Green | Blue | |
| z | 17.64 | ||
| znorm | Inf | ||
| sky | -Inf | -Inf | -Inf |
| S/N | 24.6 | 41.8 | 44.9 |
| S/N(c) | 0.0 | 0.0 | 0.0 |
| SN(E/C) |
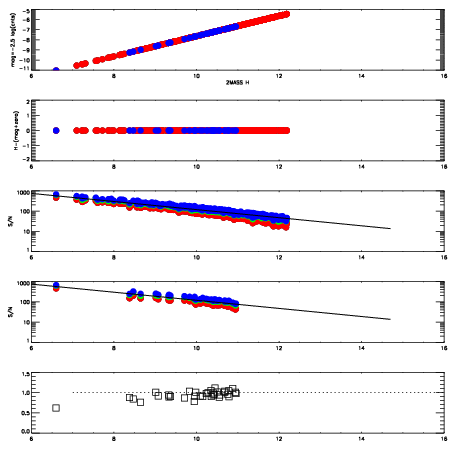
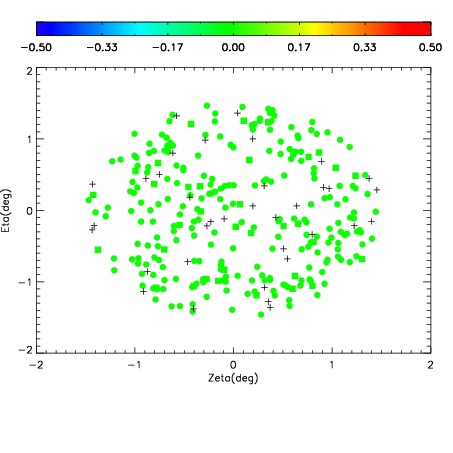
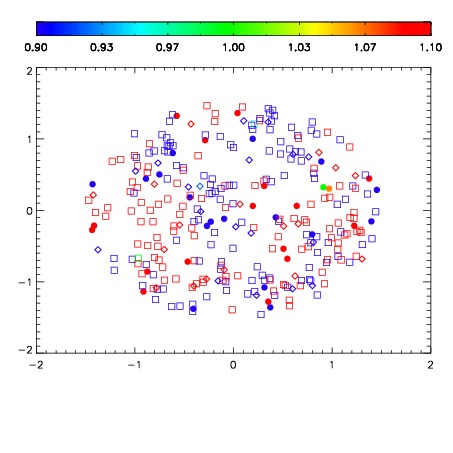
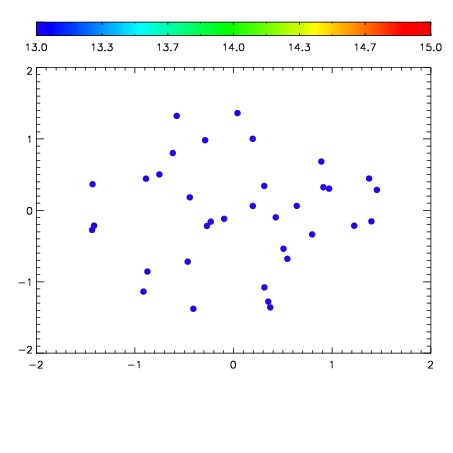

| Frame | Nreads | Zeropoints | Mag plots | Spatial mag deviation | Spatial sky 16325A emission deviations (filled: sky, open: star) | Spatial sky continuum emission | Spatial sky telluric CO2 absorption deviations (filled: H < 10) | |||||||||||||||||||||||
| 0 | 0 |
|
|
|
|
|
|
| IPAIR | NAME | SHIFT | NEWSHIFT | S/N | NAME | SHIFT | NEWSHIFT | S/N |
| 0 | 07870016 | 0.468794 | 0.00000 | 18.9570 | 07870013 | -0.00165802 | 0.470452 | 18.9479 |
| 1 | 07870015 | 0.467932 | 0.000862002 | 19.0135 | 07870014 | -0.00382572 | 0.472620 | 18.9781 |
| 2 | 07870012 | 0.466105 | 0.00268897 | 18.8794 | 07870017 | -0.000403107 | 0.469197 | 18.9087 |
| 3 | 07870011 | 0.466588 | 0.00220600 | 18.8698 | 07870010 | 0.00000 | 0.468794 | 18.7811 |