| Red | Green | Blue | |
| z | 17.64 | ||
| znorm | Inf | ||
| sky | -Inf | -Inf | -Inf |
| S/N | 18.4 | 34.0 | 35.6 |
| S/N(c) | 0.0 | 0.0 | 0.0 |
| SN(E/C) |
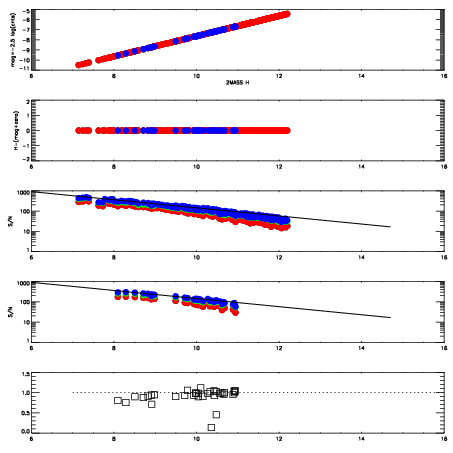

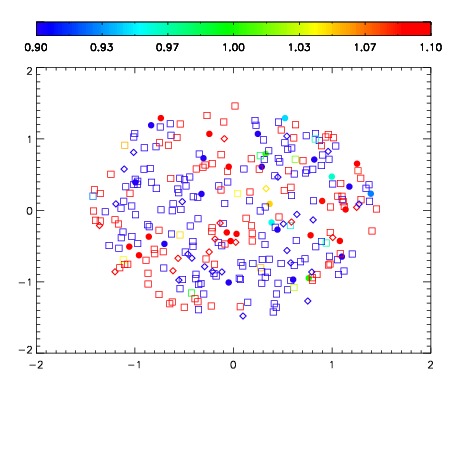
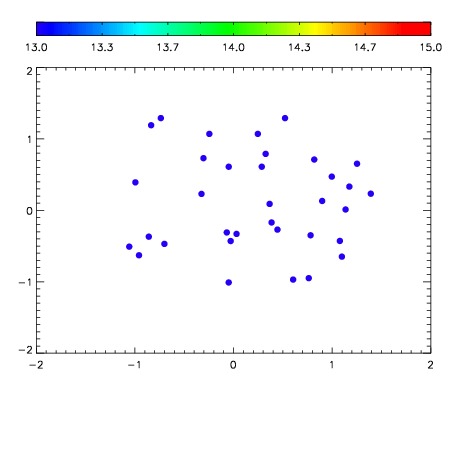

| Frame | Nreads | Zeropoints | Mag plots | Spatial mag deviation | Spatial sky 16325A emission deviations (filled: sky, open: star) | Spatial sky continuum emission | Spatial sky telluric CO2 absorption deviations (filled: H < 10) | |||||||||||||||||||||||
| 0 | 0 |
|
|
|
|
|
|
| IPAIR | NAME | SHIFT | NEWSHIFT | S/N | NAME | SHIFT | NEWSHIFT | S/N |
| 0 | 07220067 | 0.479963 | 0.00000 | 18.4149 | 07220060 | 0.00320333 | 0.476760 | 18.4713 |
| 1 | 07220059 | 0.474023 | 0.00593999 | 18.6063 | 07220057 | 0.00000 | 0.479963 | 18.6468 |
| 2 | 07220066 | 0.479741 | 0.000221997 | 18.3304 | 07220068 | 0.000888159 | 0.479075 | 18.4193 |
| 3 | 07220058 | 0.474375 | 0.00558800 | 18.2503 | 07220065 | 0.000578437 | 0.479385 | 18.3318 |
| 4 | 07220062 | 0.478241 | 0.00172201 | 17.9206 | 07220061 | 0.000443671 | 0.479519 | 18.2850 |
| 5 | 07220063 | 0.479365 | 0.000598013 | 17.8737 | 07220064 | 0.00211870 | 0.477844 | 17.9493 |